Dow Jones Industrial Average rebounds as Crude Oil prices retreat
- US equities staged a broad rebound on Monday as easing fears over the Strait of Hormuz drove a sharp pullback in Oil prices, lifting risk sentiment across the board.
- Nvidia advanced around 2% as its annual artificial intelligence conference kicked off in San Jose, boosting the wider chip and tech sector.
- Markets are focused on the Fed's rate statement on Wednesday, with a rate hold widely expected.

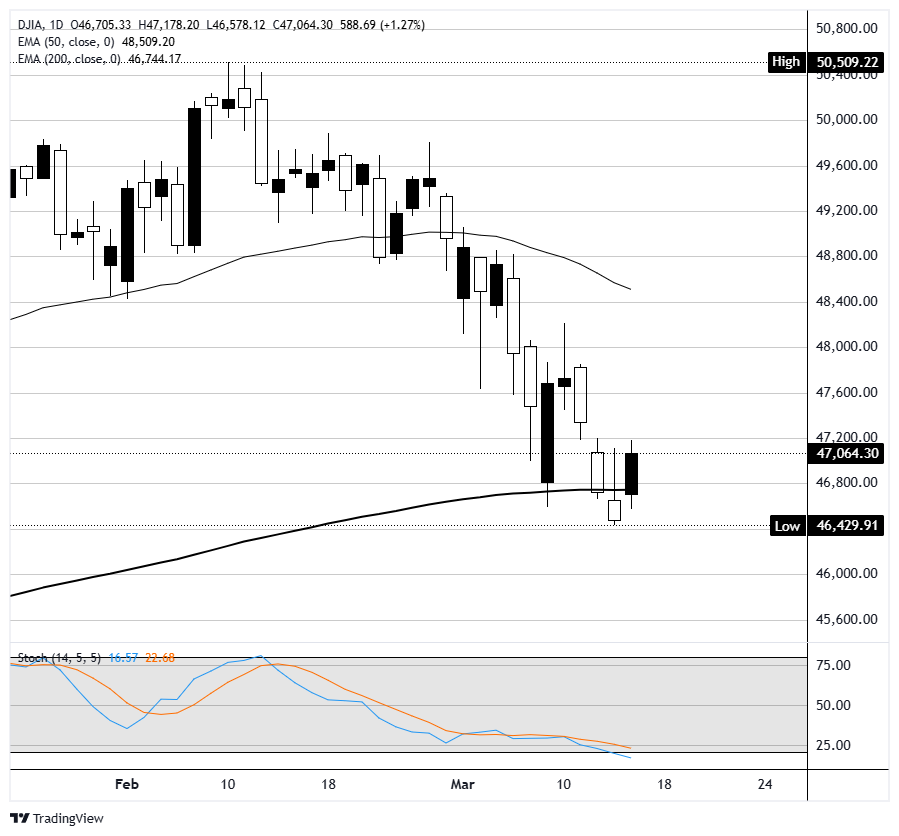
The Dow Jones Industrial Average (DJIA) climbs around 1.2% on Monday, reclaiming ground above 47,000 after Friday's subdued close near 46,500. The S&P 500 rose over 1%, recovering back toward the 6,700 level, while the Nasdaq Composite gained more than 1.2%, closing near 22,400. Monday's broad advance broke a three-week losing streak for all three major US indices, driven by a combination of easing geopolitical risk around the Iran conflict, falling Oil prices, and a fresh wave of enthusiasm for artificial intelligence heading into Nvidia's flagship developer conference.
Strait of Hormuz fears ease, Oil falls sharply
The primary catalyst for Monday's recovery was a significant retreat in Crude Oil prices after reports over the weekend suggested that selected tankers carrying liquified petroleum gas had been permitted to cross the Strait of Hormuz. The development indicated that, despite escalating rhetoric between Iran, Israel, and the US, Tehran is maintaining a degree of leniency toward energy exports to allied nations. West Texas Intermediate crude fell nearly 4% to around $95 per barrel, pulling back from the elevated levels that had stoked inflation fears throughout last week. Brent crude, which had settled above $100 per barrel for the first time since August 2022 on Friday, also declined sharply. The pullback in Oil eased pressure on consumer-facing sectors and helped yields retreat across the Treasury curve, with the 10-year yield dipping to around 4.22%, supporting equity valuations broadly.
Tech surges on Nvidia GTC conference
Technology and semiconductor stocks were among the session's strongest performers, buoyed by the opening of Nvidia's (NVDA) annual GTC Artificial Intelligence Conference in San Jose, California. Nvidia rose around 2.4%, as CEO Jensen Huang's keynote drew widespread attention from institutional investors and developers tracking advances in accelerated computing. The optimism spilled across the broader chip space, with Micron (MU) jumping over 5% ahead of its quarterly earnings report due Wednesday and Intel (INTC) surging around 6%, while Seagate (STX) added nearly 6%. Within the Dow itself, Caterpillar (CAT) and Goldman Sachs (GS) were also among the leading gainers, each rising around 2%, as the broader retreat in yields supported economically sensitive and financial stocks. The CBOE Volatility Index fell over 7%, dropping back toward 25, signalling a meaningful improvement in near-term market sentiment.
Meta rises on AI-driven workforce restructuring reports
Meta (META) was a notable outperformer, jumping close to 3% after a Friday report indicated the company is considering laying off approximately 20% of its global workforce, with efficiency gains from artificial intelligence cited as a key driver behind the potential headcount reduction. Investors interpreted the news as a positive for Meta's cost structure and margins, reinforcing the broader market narrative that AI adoption is accelerating productivity gains across major technology companies. The move also helped lift sentiment for other large-cap technology names closely associated with AI infrastructure spending.
FOMC meeting in focus as rate cut timeline shifts further out
With the Federal Open Market Committee (FOMC) convening Tuesday for a two-day policy meeting, markets are in a holding pattern ahead of Wednesday's rate decision and the quarterly Summary of Economic Projections (SEP), including the updated dot plot. The CME FedWatch Tool shows a roughly 92%–94% probability that the Fed will leave rates unchanged at 3.50%–3.75%, a near-certainty given stubborn inflation and the geopolitical backdrop. The SEP update is arguably the more consequential element, as it will offer the first official Fed view that incorporates the economic impact of the Iran conflict, surging Oil prices, and President Trump's 15% global tariffs.
Rate cut expectations have shifted materially over recent weeks: traders have moved the probability of a first cut from June to December, while Goldman Sachs now forecasts cuts in September and December, and Barclays has pared its projection to a single reduction in September. The challenging cross-current leaves the Fed's forward guidance on Wednesday as the key market event of the week. Chair Powell's press conference is scheduled for 19:30 GMT on Wednesday, March 18.
Dow Jones daily chart
Dow Jones FAQs
The Dow Jones Industrial Average, one of the oldest stock market indices in the world, is compiled of the 30 most traded stocks in the US. The index is price-weighted rather than weighted by capitalization. It is calculated by summing the prices of the constituent stocks and dividing them by a factor, currently 0.152. The index was founded by Charles Dow, who also founded the Wall Street Journal. In later years it has been criticized for not being broadly representative enough because it only tracks 30 conglomerates, unlike broader indices such as the S&P 500.
Many different factors drive the Dow Jones Industrial Average (DJIA). The aggregate performance of the component companies revealed in quarterly company earnings reports is the main one. US and global macroeconomic data also contributes as it impacts on investor sentiment. The level of interest rates, set by the Federal Reserve (Fed), also influences the DJIA as it affects the cost of credit, on which many corporations are heavily reliant. Therefore, inflation can be a major driver as well as other metrics which impact the Fed decisions.
Dow Theory is a method for identifying the primary trend of the stock market developed by Charles Dow. A key step is to compare the direction of the Dow Jones Industrial Average (DJIA) and the Dow Jones Transportation Average (DJTA) and only follow trends where both are moving in the same direction. Volume is a confirmatory criteria. The theory uses elements of peak and trough analysis. Dow’s theory posits three trend phases: accumulation, when smart money starts buying or selling; public participation, when the wider public joins in; and distribution, when the smart money exits.
There are a number of ways to trade the DJIA. One is to use ETFs which allow investors to trade the DJIA as a single security, rather than having to buy shares in all 30 constituent companies. A leading example is the SPDR Dow Jones Industrial Average ETF (DIA). DJIA futures contracts enable traders to speculate on the future value of the index and Options provide the right, but not the obligation, to buy or sell the index at a predetermined price in the future. Mutual funds enable investors to buy a share of a diversified portfolio of DJIA stocks thus providing exposure to the overall index.
Author

Joshua Gibson
FXStreet
Joshua joins the FXStreet team as an Economics and Finance double major from Vancouver Island University with twelve years' experience as an independent trader focusing on technical analysis.