Dow Jones Industrial Average futures slip as Iran tensions simmer, Fed week looms
- DJIA futures ease on Monday as Iran ceasefire hopes fade and Oil prices climb back toward multi-month highs.
- West Texas Intermediate and Brent both jumped roughly 3% after Trump scrapped a planned envoy trip to Pakistan for Iran talks.
- The Federal Reserve is widely expected to hold rates steady on Wednesday, in what is likely Jerome Powell's final meeting as chair.
- A flood of Magnificent Seven earnings and Thursday's Personal Consumption Expenditures Price Index round out a packed macro week.

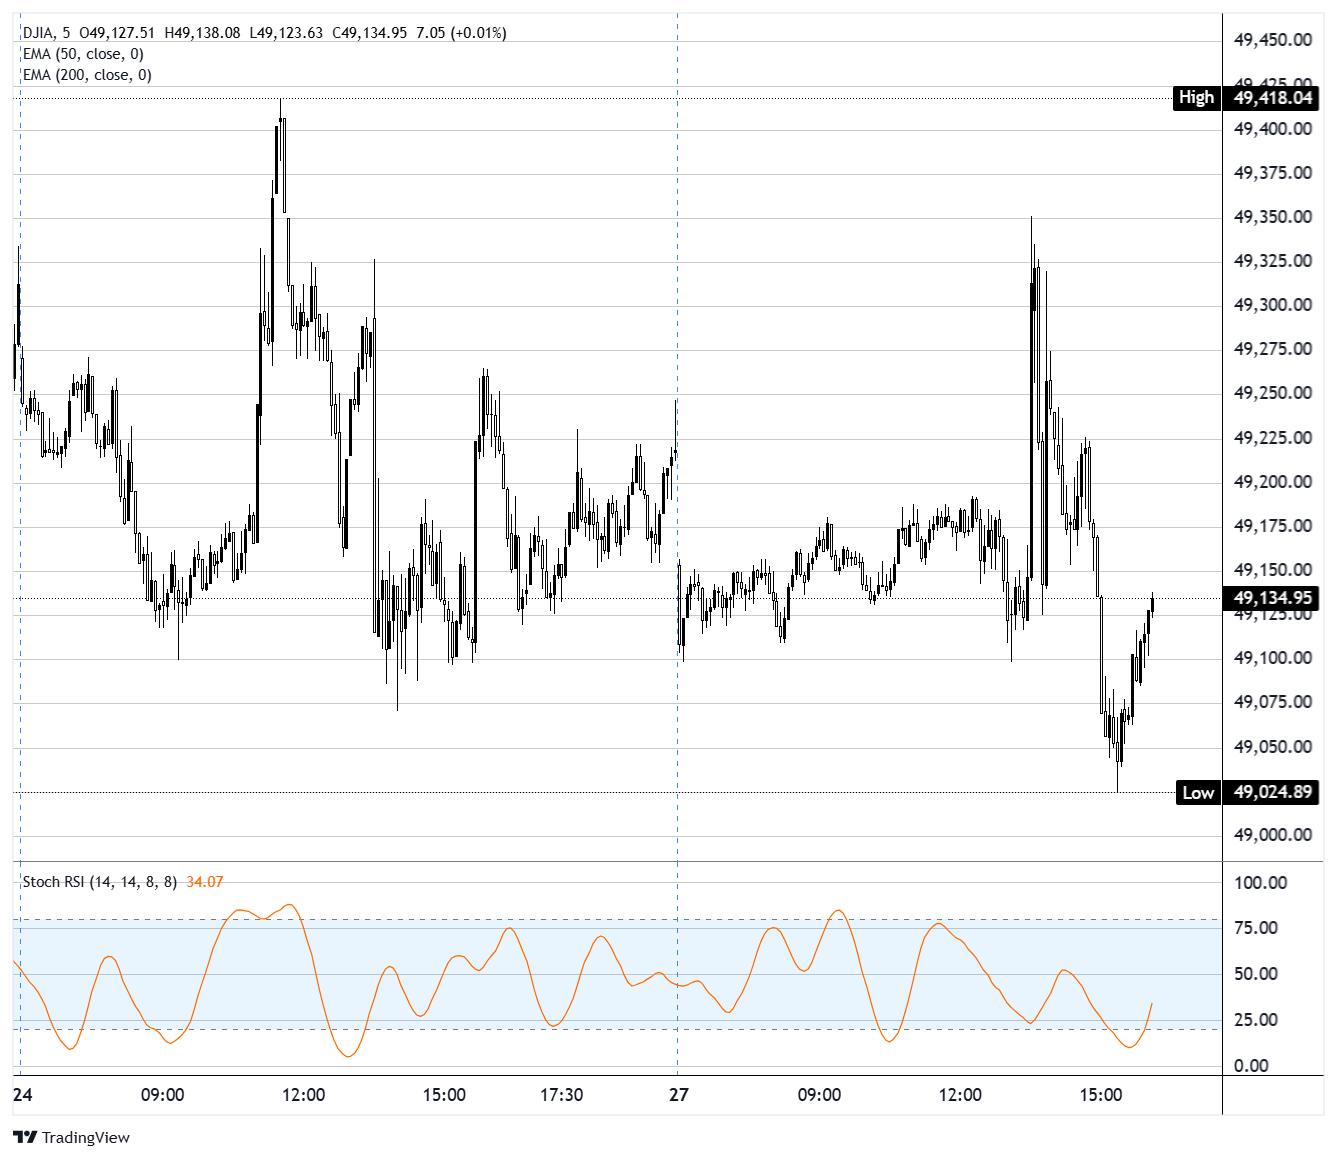
Dow Jones Industrial Average (DJIA) futures trade around 0.4% lower on Monday, slipping to near 49,100 after dipping briefly below 49,050 earlier in the session. The S&P 500 shed about 0.2%, and the Nasdaq Composite gave back roughly 0.4%, with both indexes pulling back from record highs notched on Friday. Stochastic RSI on the 5-minute chart sits in mid-range near 34, suggesting the move down still has some room before momentum stretches.
Iran impasse keeps Oil bid
The session's tone was set over the weekend, when President Donald Trump canceled plans to send envoys Steve Witkoff and Jared Kushner to Pakistan for ceasefire talks tied to Iran. Iran's Foreign Ministry confirmed no Tehran-Washington meeting is currently scheduled, even as Axios reported Iran has floated a fresh proposal to reopen the Strait of Hormuz in exchange for deferring nuclear talks. Oil traders ran with the supply uncertainty: WTI futures pushed above $97 a barrel and Brent topped $109, both up roughly 3% on the day. Vital Knowledge's Adam Crisafulli described the headlines as "a modest negative" but maintained the conflict remains on a path toward de-escalation, a view that has helped equities hold up reasonably well despite the energy shock.
Fed in focus, hold all but priced in
Wednesday's Federal Open Market Committee (FOMC) decision lands at 18:00 GMT, with the press conference at 18:30 GMT. CME FedWatch puts the probability of a hold at the current 3.50% to 3.75% range at roughly 99%, the highest pre-meeting reading on record. Markets have effectively given up on near-term cuts, with Polymarket showing 40% odds of zero cuts across all of 2026 and just 28% pricing one. The story for traders is the language: any softening on the inflation outlook, particularly given the Oil-driven pressures, could revive front-end cut bets. This is also widely expected to be Powell's swan song before Kevin Warsh, Trump's nominee, takes over.
Big tech earnings the real swing factor
Five of the Magnificent Seven report this week, and they will largely determine whether the rally that took the S&P 500 above 7,100 last week extends or stalls. Microsoft (MSFT), Meta (META), Alphabet (GOOGL), and Amazon (AMZN) all release on Wednesday after the close, with Apple (AAPL) on Thursday. JPMorgan upped its year-end S&P 500 target to 7,600 from 7,200 on Friday, citing tech and AI as the structural underpinning. Strategist Fabio Bassi flagged a "follow the winners" stance over buying laggards, given parts of the energy-sensitive market are now structurally impaired by the Oil shock. The bar is high, with capex commentary likely to drive the post-earnings tape as much as the headline numbers.
Verizon, Domino's, Qualcomm headline single-stock action
Verizon (VZ) added roughly 3.5% after raising its 2026 adjusted earnings outlook on the back of stronger Q1 profit and revenue. Qualcomm (QCOM) surged about 10% on reports it is partnering with OpenAI and MediaTek (MDTKF) on a smartphone processor push. On the downside, Domino's Pizza (DPZ) tumbled around 10% after missing first-quarter Wall Street estimates, while Marvell Technology (MRVL) shed more than 5% after its newly acquired Celestial AI lost orders from chip-photonics firm POET Technologies (POET), which itself collapsed nearly 50%.
PCE, GDP, and ISM cap a heavy data slate
Beyond the Fed, Thursday brings the Q1 advance Gross Domestic Product (GDP) print at 12:30 GMT, with consensus looking for 2.2% annualised growth versus the prior 0.5%. The same release window delivers March Personal Consumption Expenditures Price Index (PCE) data, with core PCE expected at 3.2% YoY, up from 3% prior. A hot print could complicate the Fed's already delicate messaging on the inflation path. Friday's Institute for Supply Management (ISM) Manufacturing PMI is expected to nudge up to 53 from 52.7, with the prices paid component watched closely for further evidence of Oil-driven cost pressures bleeding into goods inflation. With Hormuz still effectively closed and earnings risk concentrated in two trading sessions, this week's range on DJIA futures could be wider than the chart's recent consolidation suggests.
Dow Jones 5-minute chart
Futures FAQs
The futures market is an exchange-based auction in which participants buy and sell contracts of an underlying asset at a predetermined future date and price. The set price is agreed upon today and is derived from the underlying asset. Futures contracts can be based on a wide range of assets, with commodities among the most popular, although currencies and indices are other common underlying assets. Futures prices depend on their underlying asset and act as a mechanism for firms, institutions, and large-position traders to manage risks through hedging.
Futures can be traded in different ways. The most common ways are via a regulated exchange or via Contracts For Difference (CFDs). In the former, liquidity is high and pricing is more transparent, with the broker serving only as an intermediary between you and the market. Still, it generally requires more capital. The largest futures exchanges are the Chicago Mercantile Exchange (CME) and the New York Mercantile Exchange (NYME). As for CFDs, these require less capital and thus trading is more flexible, but at the cost of less transparency.
The E-mini S&P 500 index, Crude Oil (Brent, WTI), Natural Gas, Gold, Silver, Copper, and soft commodities such as grains are among the most actively traded contracts. These offer strong liquidity and are closely followed by traders worldwide. Futures market volume consistently exceeds spot market volume, often significantly. This dominance is driven by leverage, hedging, and higher liquidity on exchanges.
Yes. Future gauges, particularly equity index futures such as those of the S&P 500 or the Nasdaq, are widely considered key gauges of market sentiment because they reflect investors’ expectations for the next session’s opening price. When equity futures drop, it is a sign of risk-aversion, signaling bearish market sentiment. On the contrary, rising equity futures suggest markets are risk on.
As a futures contract approaches its maturity date, the futures price converges upon the spot price, becoming almost identical at expiration. However, prices can diverge significantly before the contract ends. A market is in contango when future prices are higher than spot prices, while the mirror image is called backwardation (when current prices are higher than future prices). For commodities, the normal state of the market is contango because holding the asset over time incurs costs such as storage or insurance fees. When markets turn from contango to backwardation – or vice versa – it signals a shift in the trend: a change from contango to backwardation is taken as a bullish sign, while going from backwardation to contango is generally considered bearish.
Author

Joshua Gibson
FXStreet
Joshua joins the FXStreet team as an Economics and Finance double major from Vancouver Island University with twelve years' experience as an independent trader focusing on technical analysis.