Dow Jones Industrial Average futures buy the headline on an Iran deal, not the fine print
- The Dow notched a fresh intraday record on Monday as a preliminary US-Iran ceasefire deal pushed Crude Oil lower and lifted risk assets.
- The agreement is unsigned until Friday and leaves Iran's nuclear program and the timing of sanctions relief unresolved.
- Wednesday's FOMC decision, Kevin Warsh's first as Fed Chair, overshadows an otherwise ignorable data week.

The Dow Jones Industrial Average (DJIA) punched to a fresh all-time intraday high on Monday, climbing around 1% as Wall Street cheered a preliminary peace agreement between the US and Iran. The catalyst is real enough; the framework reopens the Strait of Hormuz, lifts the US naval blockade, and extends the existing ceasefire by 60 days, which sent Crude Oil sliding and pulled some heat out of the energy-driven inflation story.
What the rally is choosing not to dwell on is that none of this is actually signed. The deal is not due to be inked until Friday in Geneva. The thorniest pieces, Iran's nuclear program and the sequencing of sanctions relief, have been pushed into a later round of talks that may or may not deliver.
Announced loudly, written later
This administration has a well-documented habit of announcing an agreement with maximum fanfare, then letting the details surface afterward, smaller and softer than billed. The cleanest precedent sits inside this very conflict: the two-week ceasefire trumpeted on April 8 sparked a relief rally of more than 2.5% across US equities. The follow-up talks in Islamabad then collapsed; Washington answered with a naval blockade.
The same script runs through the trade file. The framework deals paraded through 2025, with the United Kingdom, China and others, were sold as breakthroughs; the China terms stayed conspicuously fuzzy, while counterparties like Switzerland later branded their own arrangement a non-binding memorandum of understanding. The takeaway for Monday's buyers is that a Sunday handshake is not a ratified treaty and Friday need not resemble the press release.
The data is a sideshow this week
None of the week's economic releases change that calculus. Monday's New York Empire State Manufacturing Index slumped to 5.7 against expectations near 14, with Industrial Production up a soft 0.1% in May; equities barely registered either print. Retail Sales on Wednesday morning will get a passing glance and little more. The week bends entirely around one event: the Federal Reserve (Fed) rate decision on Wednesday evening, the first Federal Open Market Committee (FOMC) meeting with Kevin Warsh in the chair.
Warsh's debut is the real catalyst
The decision lands at 18:00 GMT. The rate itself is close to settled; CME FedWatch puts the probability of no change near 97%, holding the benchmark in its 3.50% to 3.75% range. What matters is the framing around it. June is a quarterly meeting, meaning it ships updated projections and a fresh dot plot; it also hands Warsh his first press conference at 18:30 GMT.
The bind for the new chair is real: Trump installed Warsh expecting lower rates. But inflation at a multi-year high and a hotter-than-expected jobs report have pushed that case back; options markets still assign roughly an 80% chance of at least one hike before year-end. If Warsh leans hawkish, the dovish hope baked into Monday's record starts to look misplaced; the fall in Crude Oil that helped power the rally only helps the Fed if the ceasefire genuinely holds.
Levels into Wednesday
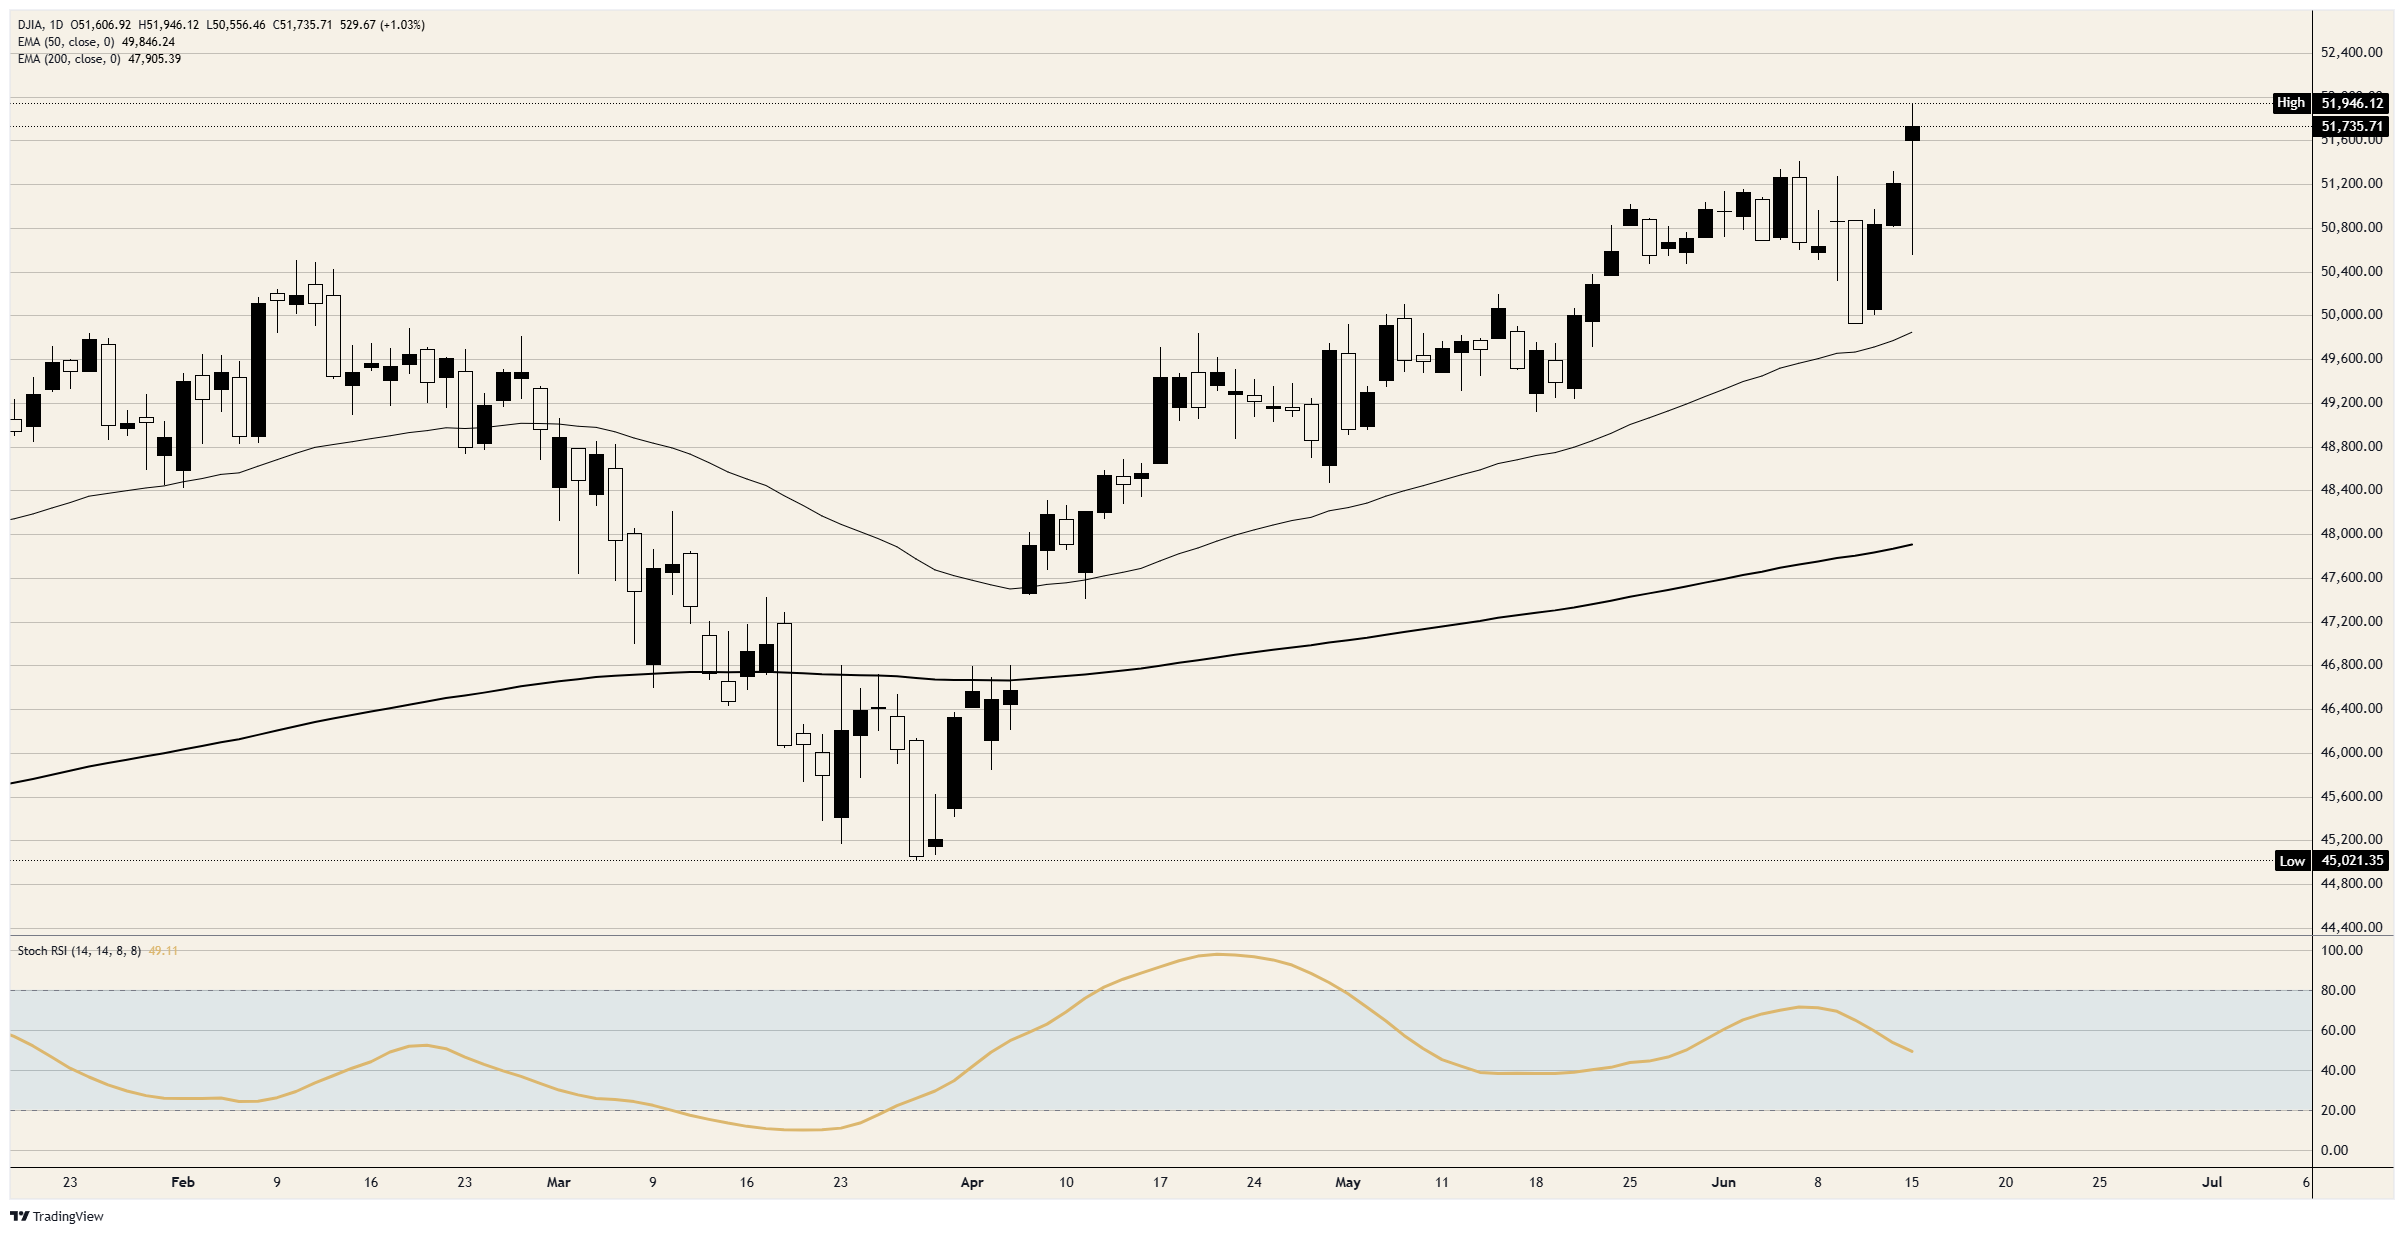
Resistance: With the index printing a record near 51,950, the magnet above is the 52,000 handle; a clean break and hold there opens fresh blue-sky territory with little overhead to lean on.
Support: The first floor sits around the early-June breakout near 50,800, below which the 50-period Exponential Moving Average (EMA) close to 49,850 separates a healthy pullback from a deeper unwind. The 200-period EMA, near 47,900, marks the broader uptrend.
Bias: The setup remains firmly bullish, but hostage to headlines. The Stochastic Relative Strength Index (Stoch RSI) sits mid-range near 49 and is turning higher, leaving momentum room to extend rather than reading overbought. A stalled signing on Friday or a hawkish Warsh on Wednesday could unwind the relief move about as fast as it arrived.
Dow Jones daily chart
Dow Jones FAQs
The Dow Jones Industrial Average, one of the oldest stock market indices in the world, is compiled of the 30 most traded stocks in the US. The index is price-weighted rather than weighted by capitalization. It is calculated by summing the prices of the constituent stocks and dividing them by a factor, currently 0.152. The index was founded by Charles Dow, who also founded the Wall Street Journal. In later years it has been criticized for not being broadly representative enough because it only tracks 30 conglomerates, unlike broader indices such as the S&P 500.
Many different factors drive the Dow Jones Industrial Average (DJIA). The aggregate performance of the component companies revealed in quarterly company earnings reports is the main one. US and global macroeconomic data also contributes as it impacts on investor sentiment. The level of interest rates, set by the Federal Reserve (Fed), also influences the DJIA as it affects the cost of credit, on which many corporations are heavily reliant. Therefore, inflation can be a major driver as well as other metrics which impact the Fed decisions.
Dow Theory is a method for identifying the primary trend of the stock market developed by Charles Dow. A key step is to compare the direction of the Dow Jones Industrial Average (DJIA) and the Dow Jones Transportation Average (DJTA) and only follow trends where both are moving in the same direction. Volume is a confirmatory criteria. The theory uses elements of peak and trough analysis. Dow’s theory posits three trend phases: accumulation, when smart money starts buying or selling; public participation, when the wider public joins in; and distribution, when the smart money exits.
There are a number of ways to trade the DJIA. One is to use ETFs which allow investors to trade the DJIA as a single security, rather than having to buy shares in all 30 constituent companies. A leading example is the SPDR Dow Jones Industrial Average ETF (DIA). DJIA futures contracts enable traders to speculate on the future value of the index and Options provide the right, but not the obligation, to buy or sell the index at a predetermined price in the future. Mutual funds enable investors to buy a share of a diversified portfolio of DJIA stocks thus providing exposure to the overall index.
Author

Joshua Gibson
FXStreet
Joshua joins the FXStreet team as an Economics and Finance double major from Vancouver Island University with twelve years' experience as an independent trader focusing on technical analysis.

















