Did chip traders buy the bottom too early?

Two days ago, semiconductor stocks were being treated as the weak link in the AI trade. By Tuesday’s close, traders were chasing them again.
Philadelphia Semiconductor Index jumped 5.2%, while Micron surged 12.2%.
That move arrived before Alphabet, Texas Instruments or Intel had delivered the week’s main evidence on cloud demand, capital spending and the health of the broader chip cycle.
That does not automatically make the rally irrational. It makes the rally conditional.
What the rally already knows
The bullish case is not built from nothing, traders already know of Micron’s June earnings, which showed persistent demand for high-bandwidth memory (HBM) and tighter supply.
TSMC then reported record second-quarter profit and lifted its full-year growth outlook, reinforcing the view that advanced-chip demand remains strong.
Tuesday added another useful signal. Vicor reported stronger quarterly revenue and a backlog of $380 million, with management saying high-performance computing demand was absorbing capacity. It is a smaller part of the AI chain, but it supports the idea that infrastructure demand has not simply disappeared.
There is still an important gap, however. Chip suppliers can show that orders are strong. They cannot prove that hyperscalers are earning enough from AI to support the pace of spending.
The spending problem Alphabet must answer
Alphabet enters earnings with 2026 capital-expenditure guidance of $180 billion to $190 billion.
The market will be watching whether Google Cloud is growing quickly enough to justify that bill, and whether free cash flow remains credible after another year of aggressive data-centre investment.
This is becoming the central question across Big Tech. Demand is no longer the only issue. Investors increasingly need to see a clear link between the money going into AI infrastructure and the cash eventually coming back out.
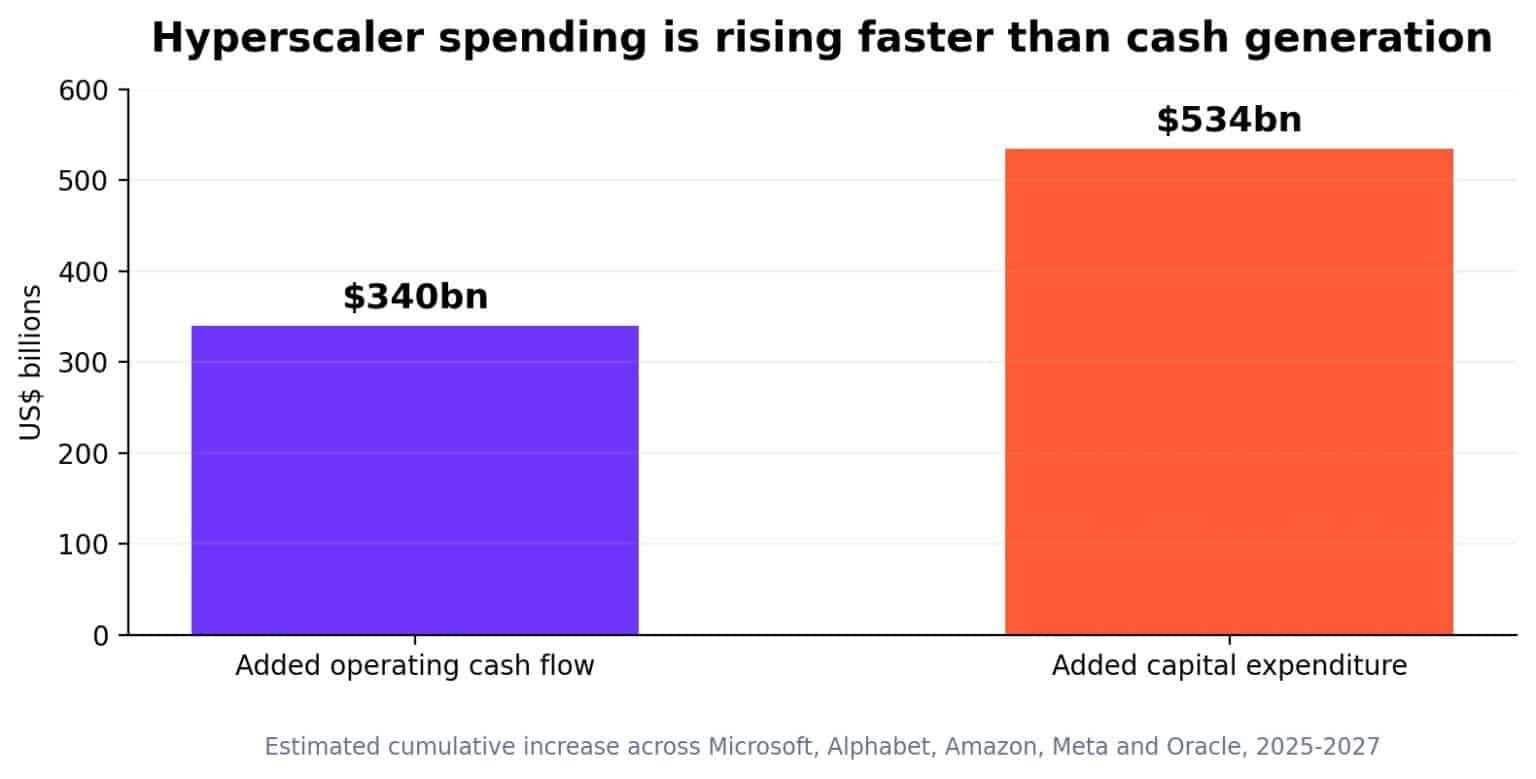
Across Microsoft, Alphabet, Amazon, Meta and Oracle, the estimated increase in capital expenditure between 2025 and 2027 is materially larger than the expected increase in operating cash flow. That does not mean the investments are failing. It means the market has less room to forgive vague guidance, delayed products or weak monetisation.
What Alphabet is fighting against
The most obvious challenge is not another chipmaker. It is the falling cost of intelligence.
Moonshot has announced Kimi K3 as a large open-weight model, with the model weights expected later in July. Open-weight systems can be downloaded, customised and operated outside a closed provider’s platform, making it easier for companies to switch providers or run models privately.
For Alphabet, that may place pressure on the price businesses are willing to pay for access to premium models. A delayed Gemini 3.5 Pro release makes the comparison more uncomfortable because competitors are moving while Google is still trying to prove that its model roadmap is on schedule.
The effect on chip demand is less straightforward. Cheaper models could weaken software pricing, but they may also encourage much wider AI adoption. More users, private deployments and new applications could still require more memory, networking, storage and computing power.
Kimi K3 can therefore be a threat to premium model economics and a catalyst for the hardware stack at the same time. This could explain why AI stocks initially sold off before traders reconsidered the threat and rushed back into the sector.
The trade in one view
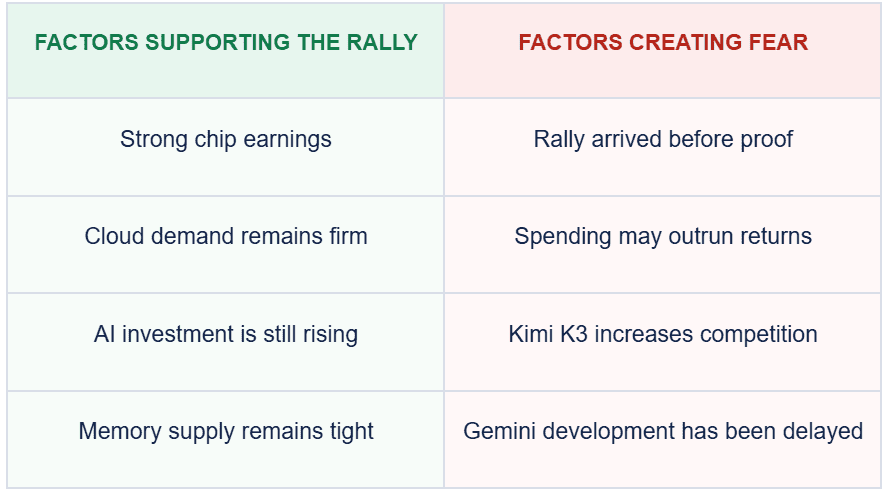
This is the balance Alphabet’s earnings must settle. The market already has evidence that infrastructure demand is strong. It still needs evidence that the economics of that demand are improving rather than becoming more expensive.
Micron is the chart of belief
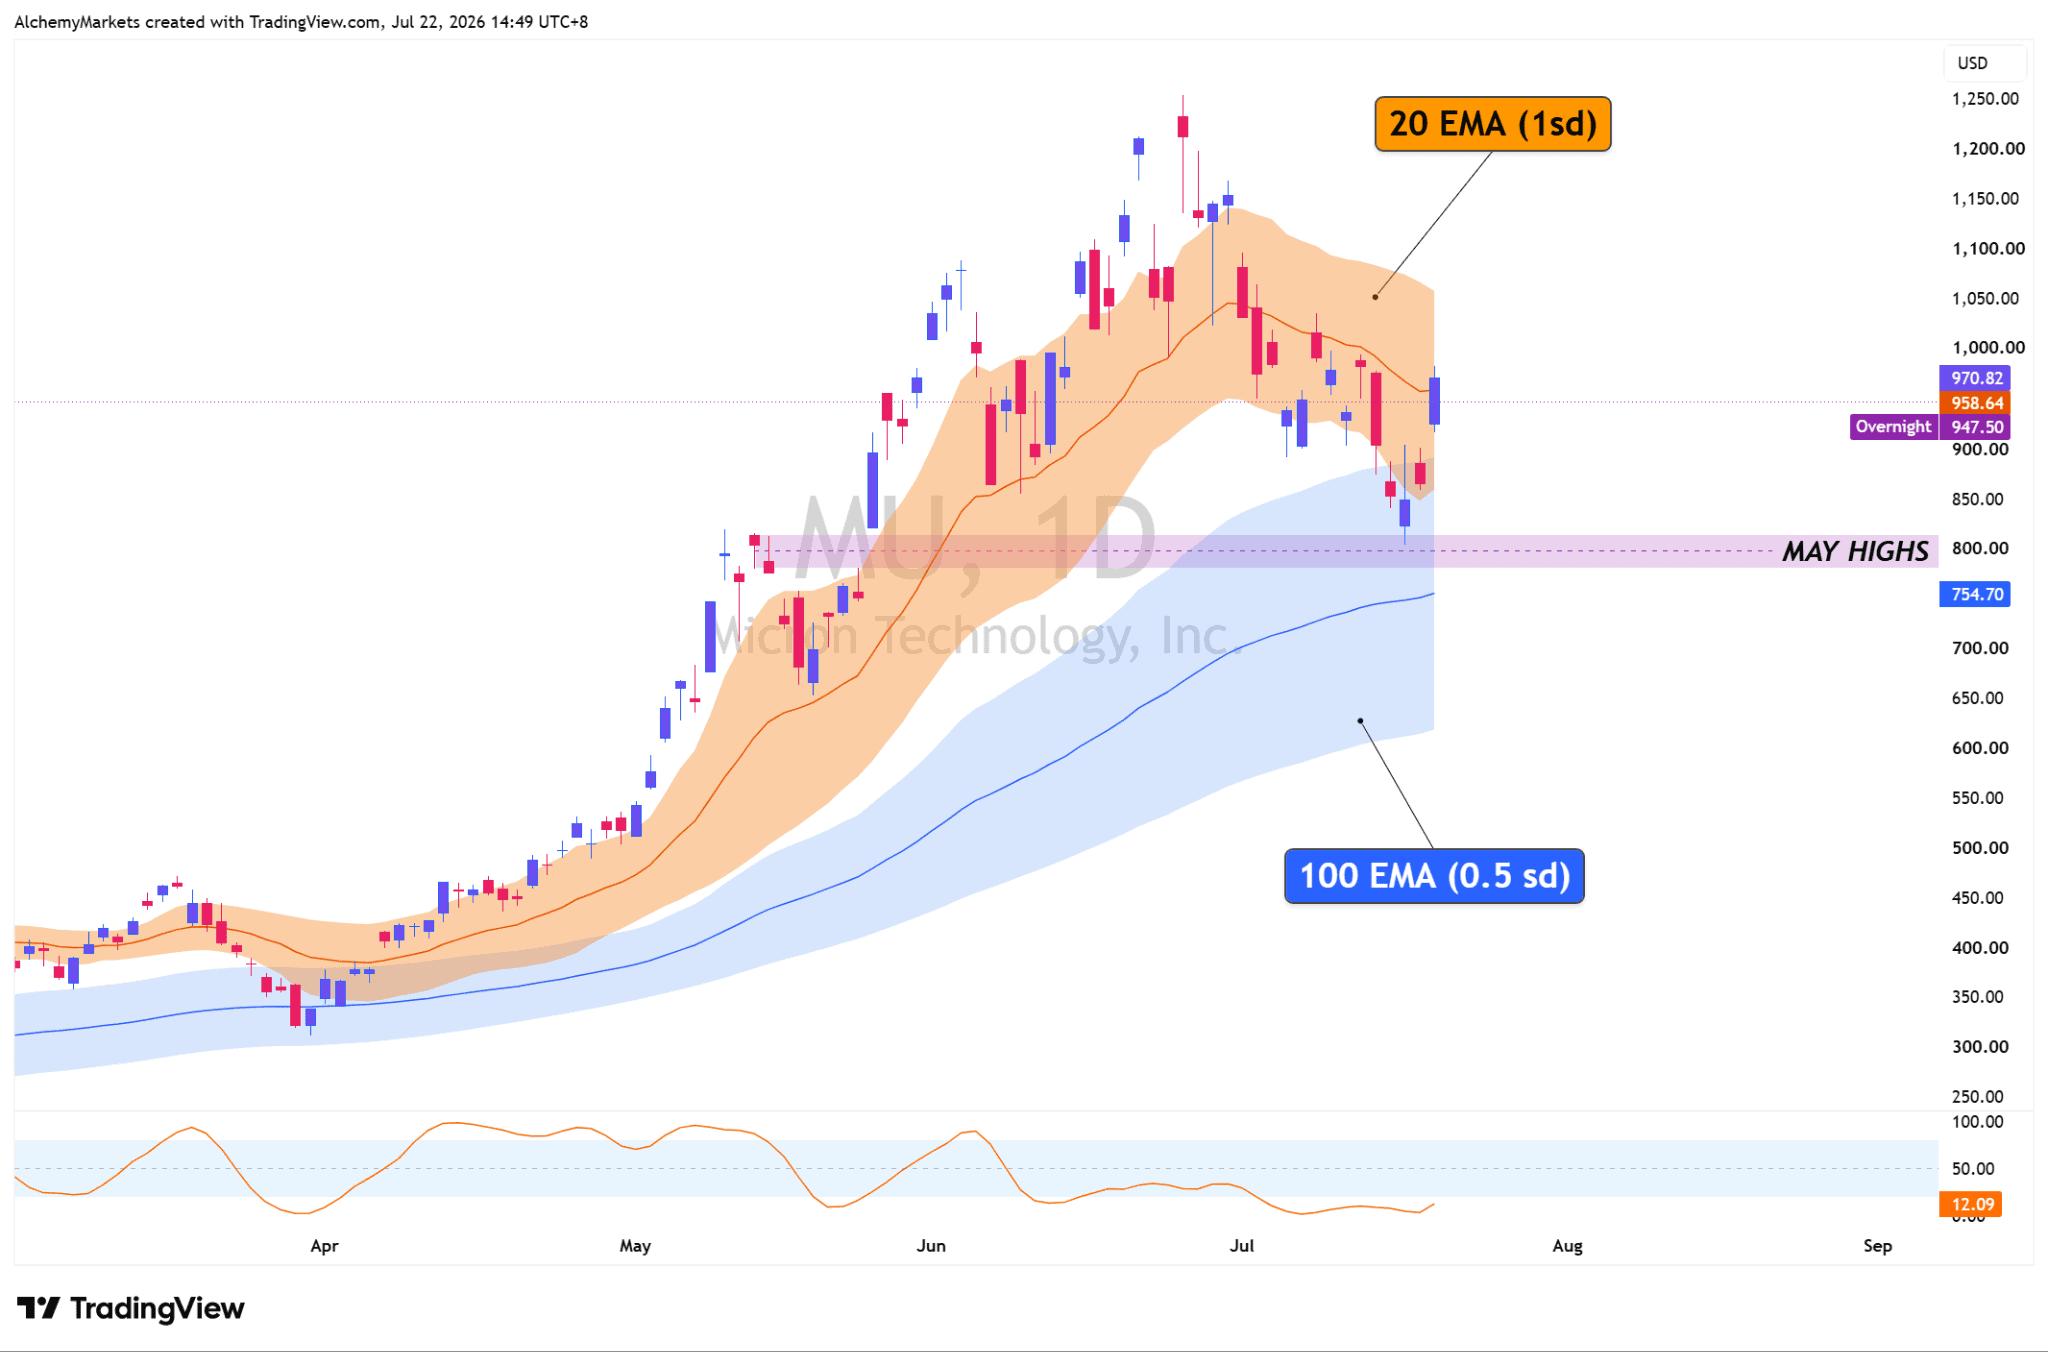
Micron’s rebound began close to its lower 100-EMA region and above the previous May highs. That is a credible technical area for buyers to defend, especially after the company’s strong earnings and guidance.
The stock has now pushed back into its 20-EMA band. Holding above the May breakout area would support the view that the correction has reset positioning without breaking the larger trend. A failure back below that floor would make Tuesday’s surge look more like a relief rally than a confirmed bottom.
Alphabet is the chart of evidence
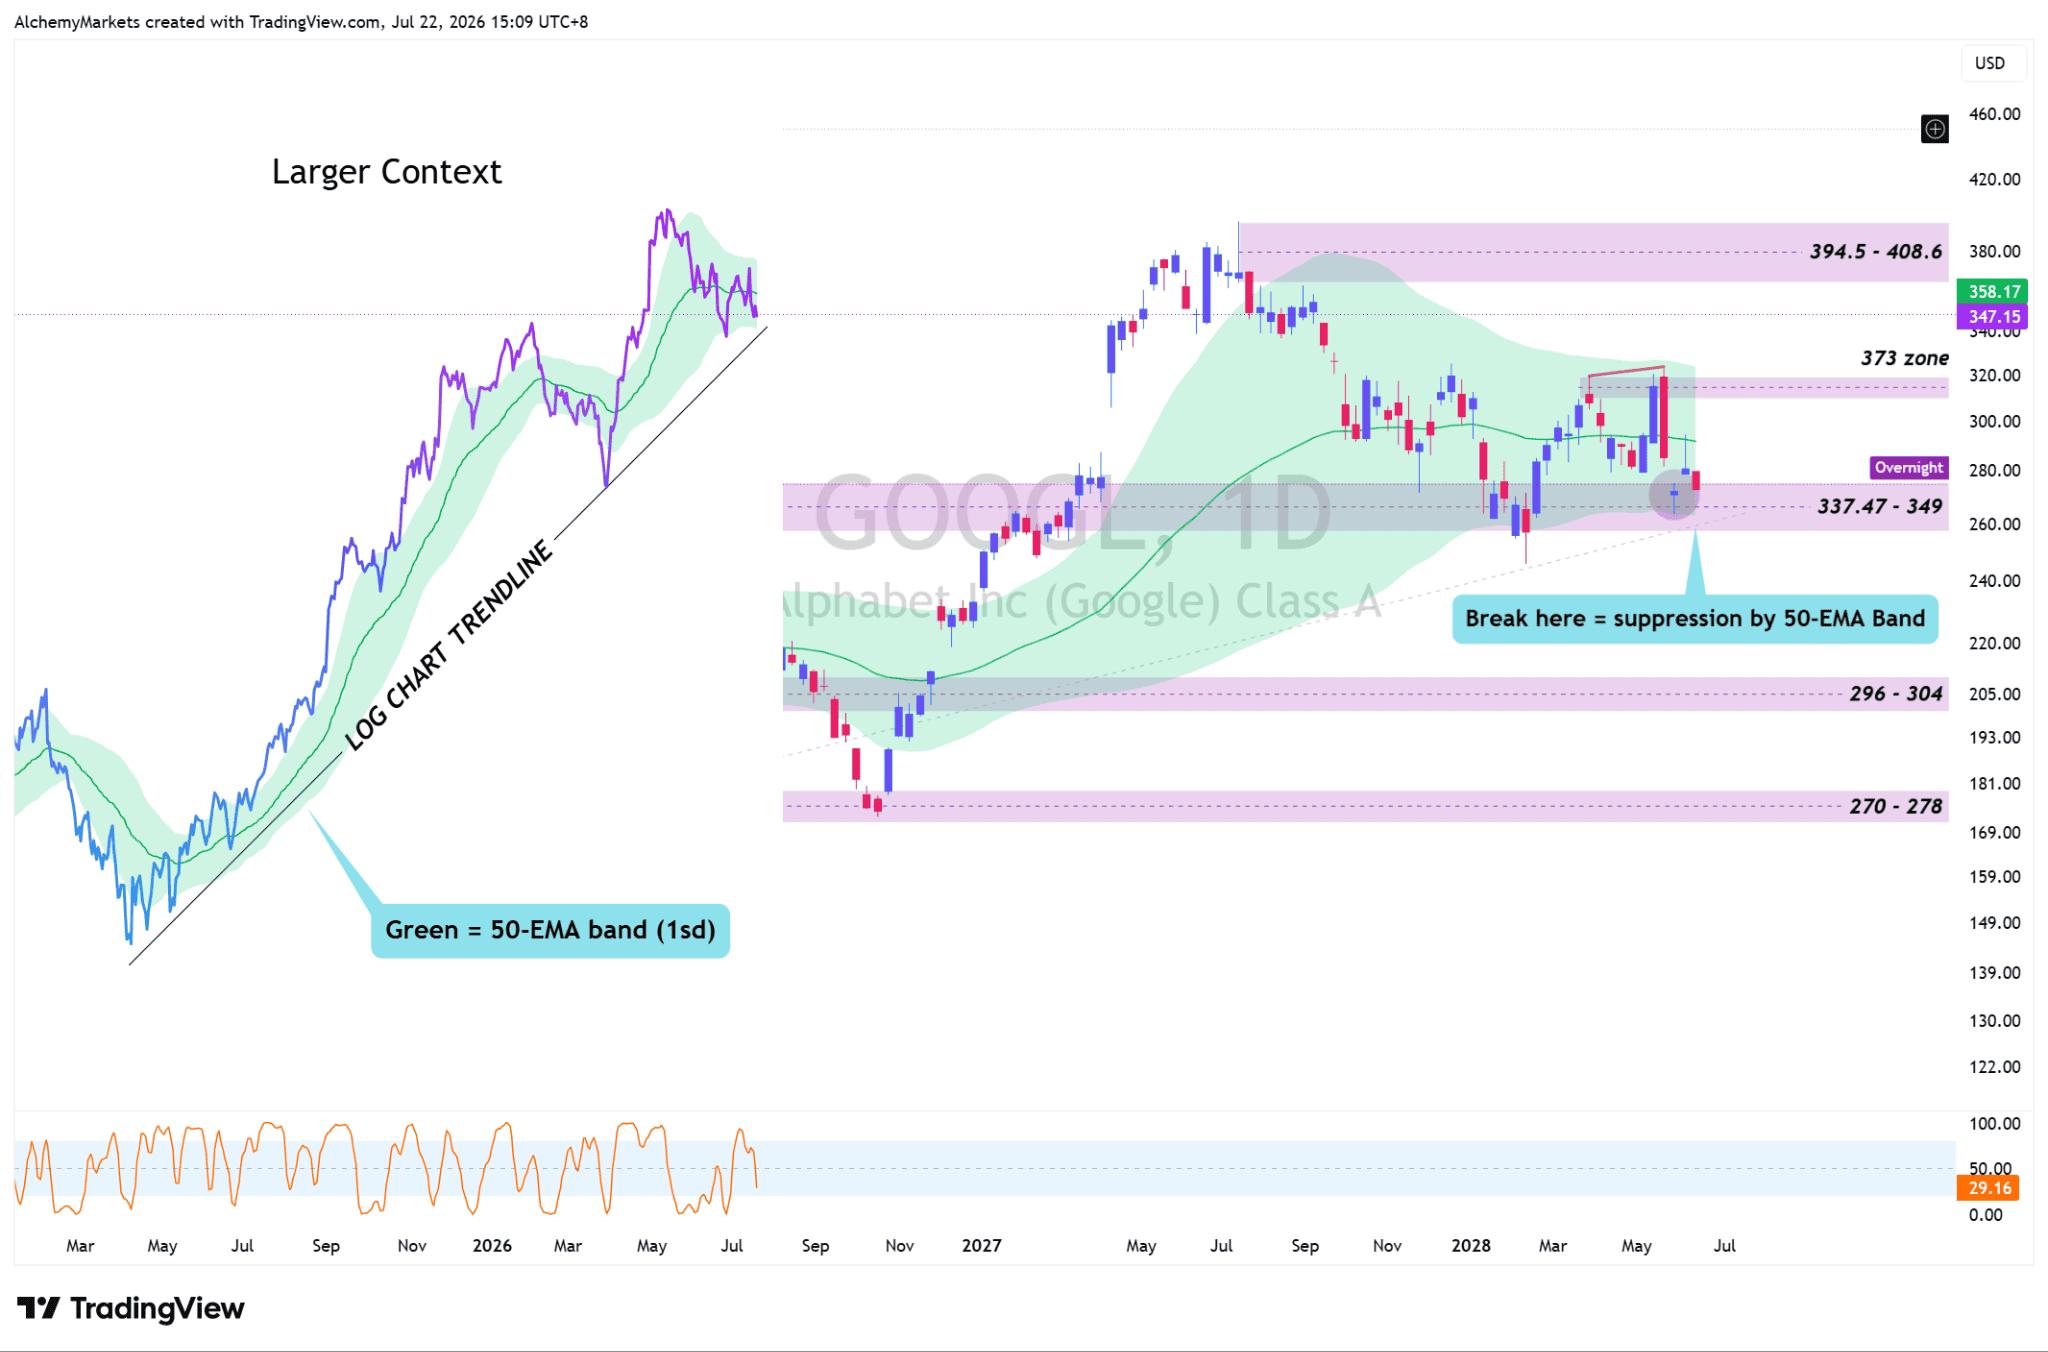
Alphabet is sitting near the 337.47-349 support zone before earnings. That keeps the immediate recovery case alive, but the first meaningful test is the daily 50-EMA band near 358.
A recovery through that band would improve the short-term structure. The 373 area is the next stronger confirmation point, followed by the larger 394.50-408.60 resistance zone. Losing current support would instead place the 296-304 area back in view.
But, keep in mind that the reaction matters more than the earnings report.
Alphabet could beat forecasts and still struggle if traders decide that cloud growth, guidance or cash generation do not justify the spending. It could also deliver an imperfect quarter and rally if management gives the market a credible path from capex to returns.
Oil leaves less room for error
Alphabet is not reporting into a perfect macro backdrop. Oil continues to trend higher and is approaching resistance near $86-$88, keeping inflation and Treasury yields in focus.
In short, oil remaining higher for longer, pressures the need for AI and memory chip companies to outperform their earnings expectations and produce solid guidance.
What would validate the rally?
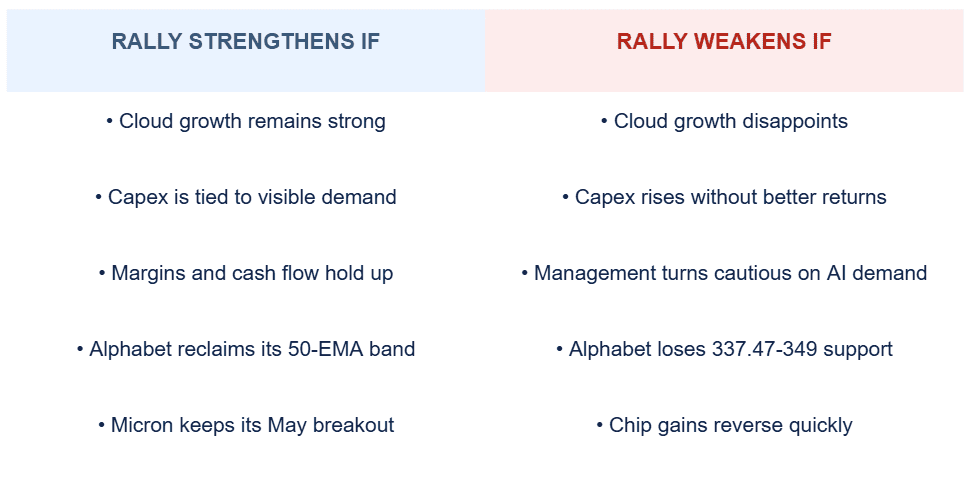
Bottom line
Traders have already started buying the bottom. Alphabet now has to prove that the AI spending boom is still creating enough revenue and cash to justify it.
Alphabet does not need to deliver a perfect quarter. It just needs to assure that: spending remains high because demand is strong, cloud growth is converting that demand into revenue, and cash generation remains credible.
If it can do that, Tuesday’s chip rally gains evidence. If it cannot, the market may discover that traders bought the bottom before the evidence was ready.
Author

Zorrays Junaid
Alchemy Markets
Zorrays Junaid has extensive combined experience in the financial markets as a portfolio manager and trading coach. More recently, he is an Analyst with Alchemy Markets, and has contributed to DailyFX and Elliott Wave Forecast in the past.