Dell Technologies: Bull flag breakout eyes all-time highs as SMCI troubles send business its way

Dell Technologies, Inc. (NYSE: DELL) is a global leader in personal computers, servers, data storage, and IT infrastructure solutions, serving enterprises, governments, and consumers worldwide. A perfect storm of technical setup and fundamental tailwind is pushing DELL sharply higher today, up 5.63%, and the chart suggests there may be more room to run.
Bull flag breakout fueled by a fundamental catalyst
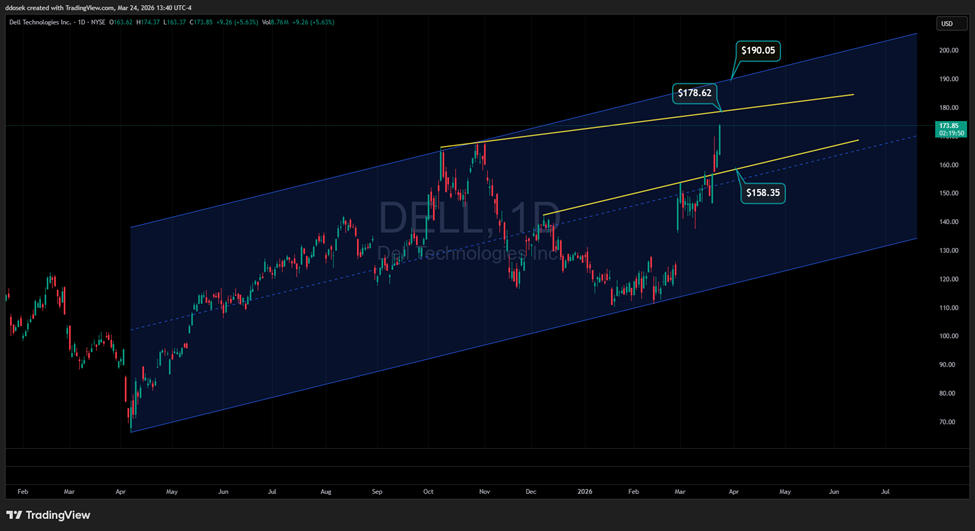
Since the end of February and through most of March, DELL has been quietly building a bull flag on the daily chart — a tight consolidation pattern following a prior advance that signals the market is pausing before the next leg higher. Bull flags are among the most reliable continuation patterns in technical analysis, and today's surge appears to be the breakout that traders were waiting for.
The catalyst? DELL is emerging as a partial beneficiary of the ongoing legal troubles surrounding Super Micro Computer (SMCI). As clients seek alternatives to SMCI for server and infrastructure solutions in the near term, Dell stands out as a natural destination for that redirected business. Fundamental tailwinds aligning with a bullish technical setup is precisely the kind of confluence that produces powerful, sustained moves.
Resistance levels standing between DELL and history
With today's move well underway, DELL is now approaching a wall of meaningful resistance. The levels to watch are:
● $178.62 — The immediate and first resistance level, which also coincides with a near-term inclining trendline on the chart. This level must be cleared on a closing basis to keep the momentum intact and confirm the bull flag breakout is legitimate.
● $179.70 — The previous all-time high. This is the line that separates a strong rally from a historic breakout. A decisive close above this level would mark new all-time high territory for DELL, a technically significant event that tends to attract additional institutional buying as overhead supply is fully exhausted.
● $190.05 — The top end of the long-term inclining parallel channel. Should price surge through the all-time highs with conviction, this becomes the next major target and represents the upper boundary of the broader channel structure that has contained DELL's price action since early 2025.
The key level to hold on any pullback
With the bull flag breakout now in play, the near-term inclining trendline support at $158.35 becomes the level to watch on any retracement. A healthy bull flag breakout will often retest the breakout level before continuing higher, and $158.35 is where that support now lives. As long as DELL holds above this level on a closing basis, the bull flag thesis remains intact.
The bottom line
DELL's chart has been telegraphing this move for weeks, and the bull flag was there for those watching closely. With a fundamental catalyst now adding fuel to the fire, the path toward the prior all-time high at $179.70 and beyond is open. Watch $178.62 as the first hurdle, and keep $190.05 on the longer-term radar if the bulls maintain control.
Author

Drew Dosek
Verified Investing
Passionate technical and cycle analyst committed to empowering traders through data-driven insights.