Dell looking higher into the $700.00 area

Dell Technologies (NYSE: DELL) is a global leader in technology infrastructure, serving enterprises, governments, and consumers through its diversified portfolio of hardware, software, storage, networking, and cloud solutions. Founded by Michael Dell in 1984, the company has evolved from a personal computer manufacturer into one of the world’s leading providers of enterprise technology infrastructure, positioning itself at the center of several long-term growth trends, including artificial intelligence, cloud computing, and data-center expansion.
The company operates through its Infrastructure Solutions Group (ISG) and Client Solutions Group (CSG). While Dell remains one of the world’s largest PC manufacturers, its growing exposure to enterprise servers, storage systems, and AI-optimized infrastructure has become an increasingly important driver of revenue and profitability. The accelerating demand for AI computing power has created significant opportunities for Dell, particularly through its partnerships with companies such as NVIDIA and its expanding portfolio of AI server solutions.
Fundamentally, Dell benefits from a large global customer base, recurring enterprise demand, strong cash flow generation, and a growing presence in high-performance computing markets. As businesses continue investing in digital transformation and AI deployment, Dell is positioned to participate in what many analysts view as a multi-year infrastructure spending cycle.
Dell is currently trading around $423.64 after an impressive rally of more than $300 per share in 2026 alone. Despite the strong advance already seen this year, our Elliott Wave analysis suggests the stock remains within a larger bullish cycle that can support substantially higher prices over the coming months.
At ElliottWave-Forecast.com, we combine Elliott Wave Theory with several proprietary tools to forecast market direction. Our analysis incorporates market correlations, technical indicators, sequence analysis, and High-Frequency areas (Blue Boxes) to identify the highest-probability paths in the market.
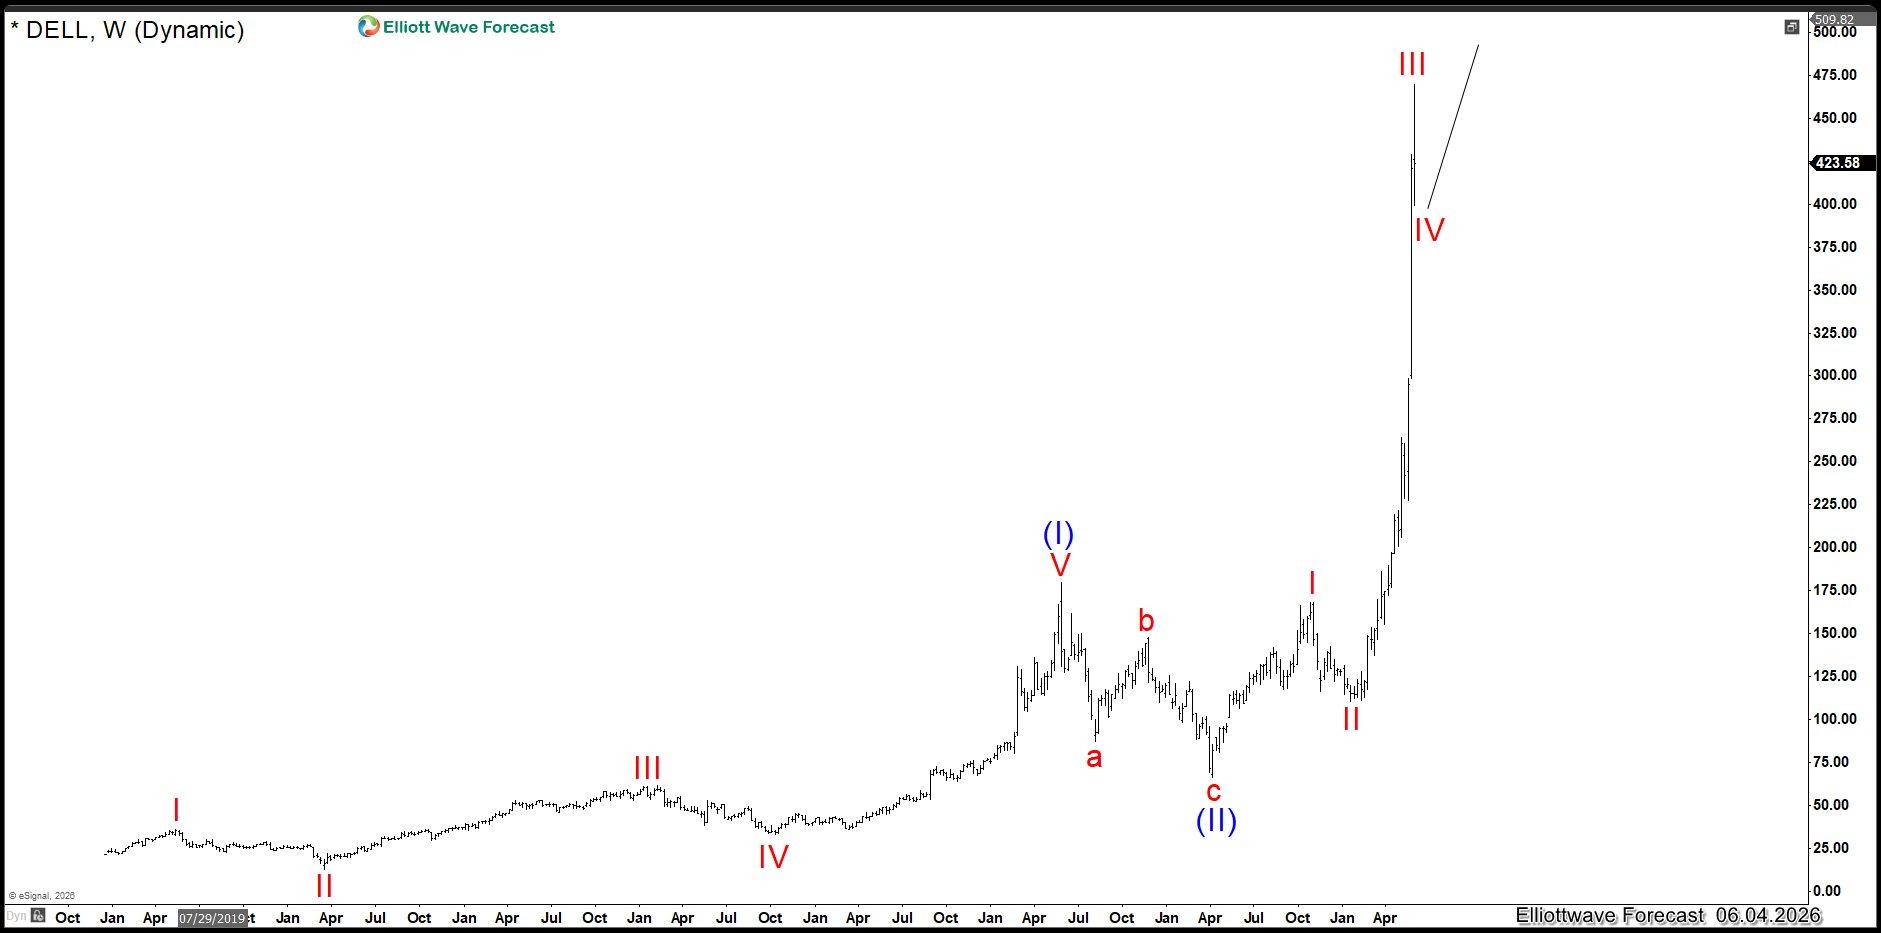
Based on the current structure, Dell appears capable of reaching the $700.00 area sometime within the next year or so. The path toward those levels can develop in one of two ways. The first scenario is a traditional five-wave impulsive advance, while the second is a super nest structure, which is often associated with stronger momentum and can lead to even higher prices over time.
The charts below illustrate both Elliott Wave scenarios. The first chart reflects the more traditional five-wave advance. Under this view, Dell is currently proposed to be in wave IV, a corrective phase within the larger bullish cycle. As long as the stock remains supported above key levels, the structure continues to favor additional upside and ultimately a move toward the $700.00 target area. The following chart shows the symbol with the Elliott Wave labels. This first path reflects the natural five-wave advance where the stock is currently correcting in wave IV before resuming higher in wave (V).
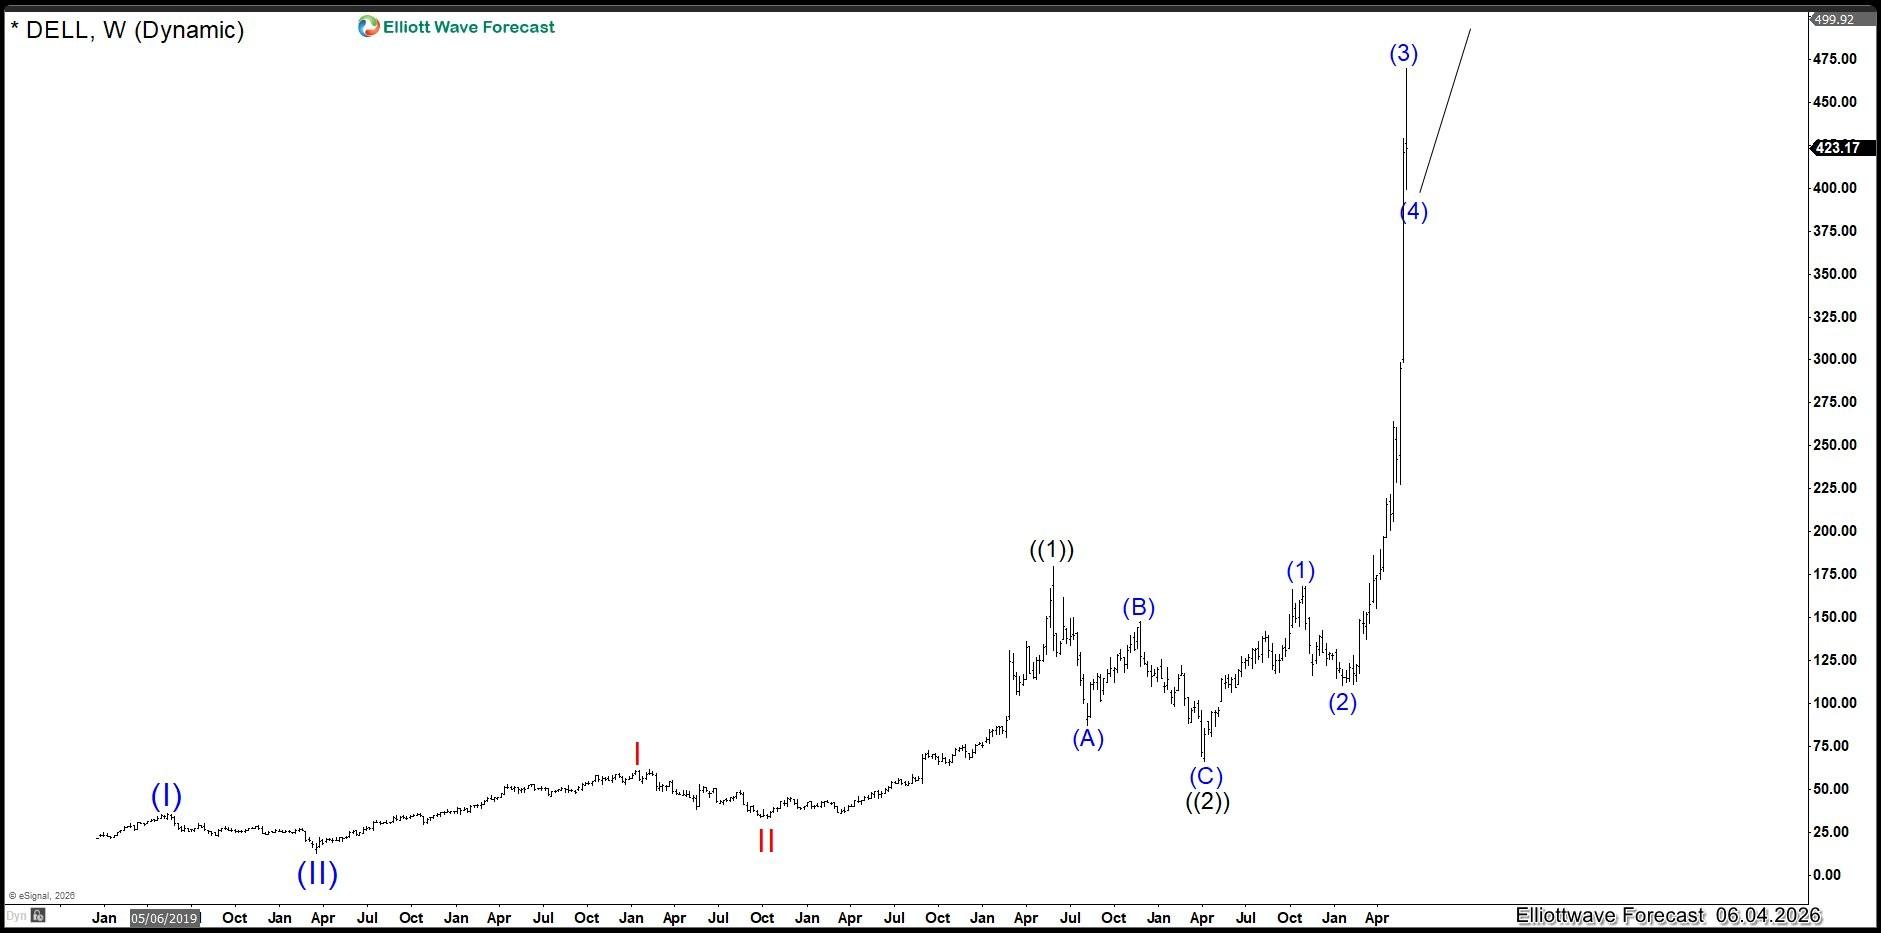
The second chart presents the super nest scenario. In this case, Dell would be developing a series of nested impulsive structures that could generate an even stronger acceleration higher. This path would support not only the $700.00 target but potentially much higher levels over time as the bullish sequence continues to extend. The super nest structure can often produce faster and more powerful advances as buyers continue to step into corrective pullbacks.
The following video explains both scenarios in greater detail and highlights why our 3-7-11 buying strategy continues to place investors on the right side of the market. Rather than chasing strength, we prefer to identify corrective pullbacks into High-Frequency areas where risk can be defined and the larger trend can be traded with greater confidence. This methodology has allowed us to remain aligned with the larger bullish trend while identifying the areas where buyers are likely to return.
Author

Elliott Wave Forecast Team
ElliottWave-Forecast.com


