DAX Elliott Wave: Buyers step in after zig zag correction

In this technical article, we’ll take a look at the Elliott Wave charts for the DAX Index. Recently, the index completed a Zig Zag correction at the Equal Legs area, where buyers stepped in. In the sections below, we’ll examine the Elliott Wave structure in more detail, outline the current forecast, and explain the pattern behind the recent price action. Before looking at the real market example, let’s first take a quick look at the Elliott Wave Zig Zag pattern.
Elliott Wave Zigzag is the most popular corrective pattern in Elliott Wave theory. It’s made of 3 swings which have 5-3-5 inner structure. Inner swings are A,B,C where A =5 waves, B=3 waves and C=5 waves. That means A and C can be either impulsive waves or diagonals. (Leading Diagonal in case of wave A or Ending in case of wave C) . Waves A and C must meet all conditions of being 5 wave structure, such as: having RSI divergency between wave subdivisions, ideal Fibonacci extensions and ideal retracements.
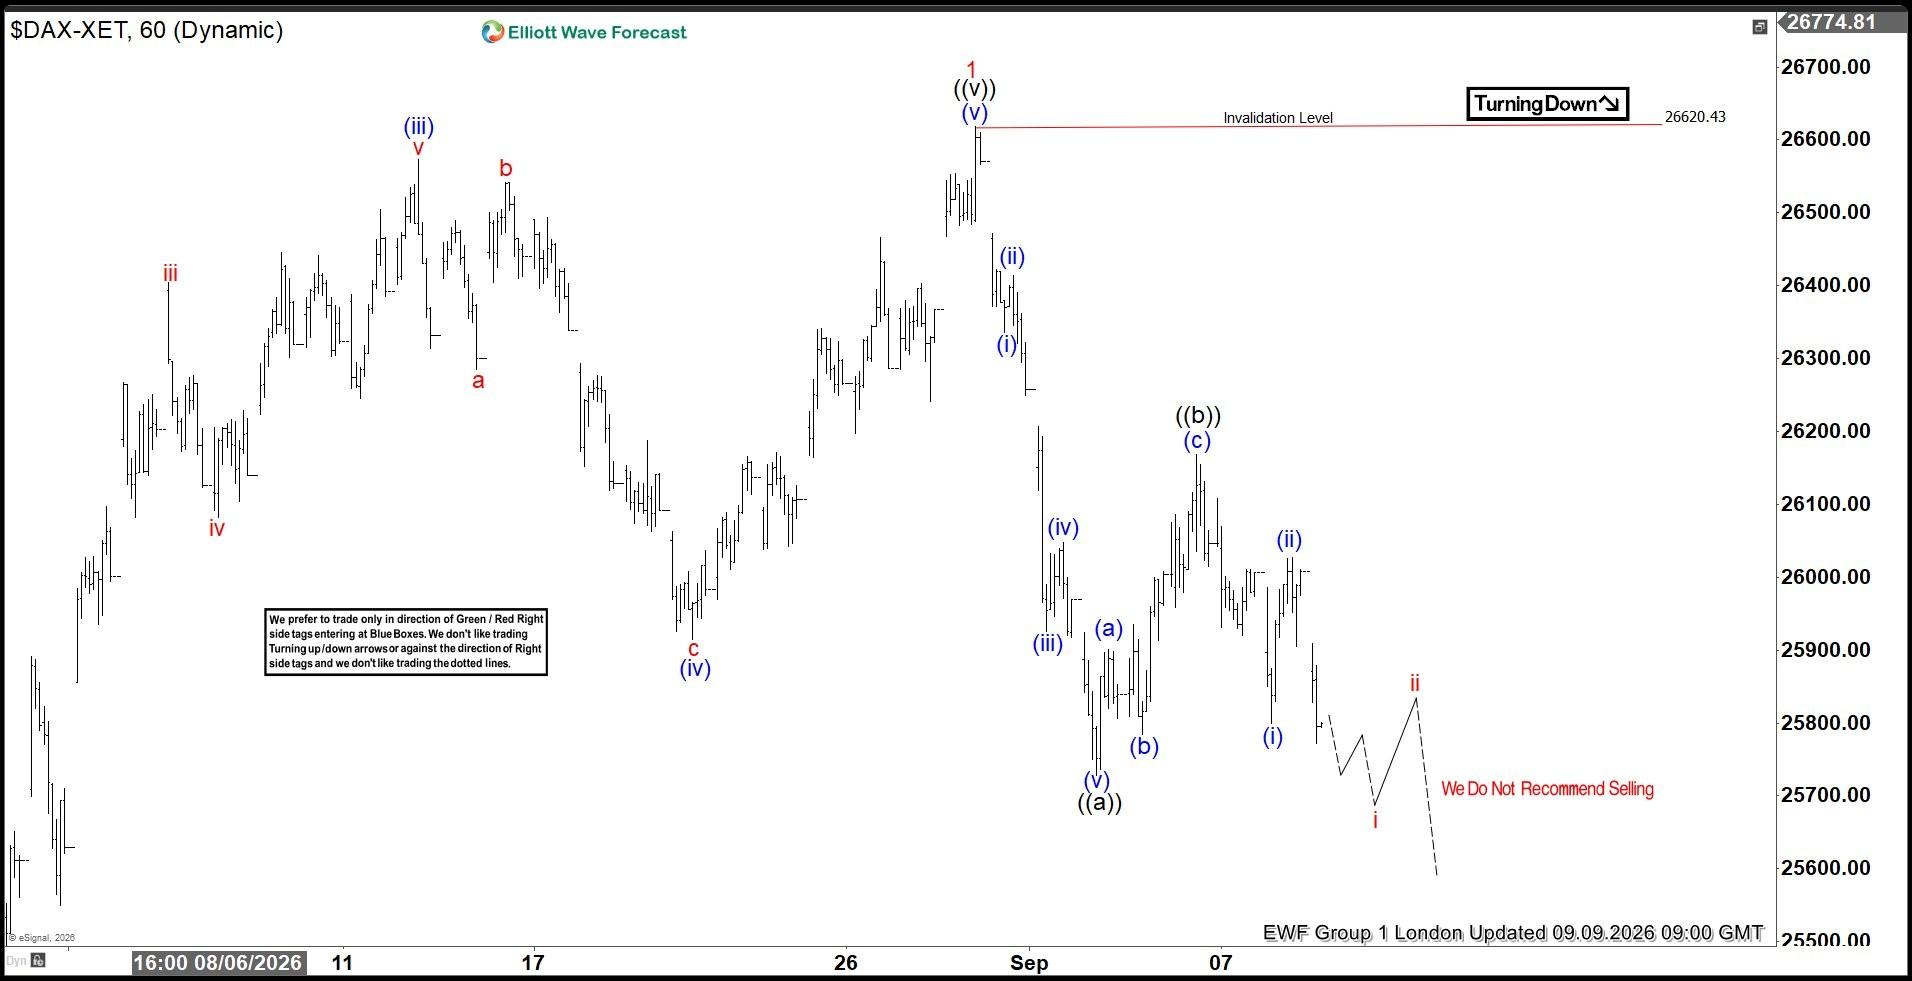
DAX one-hour Elliott Wave analysis 09.09.2026
We could clearly identify a five-wave structure in the first leg of the pullback, wave ((a)), followed by a three-wave bounce in wave ((b)). The DAX Index was then developing wave ((c)), which was expected to subdivide into five waves as well.
We were looking for a break below the wave ((a)) low to confirm further downside extension in wave ((c)). Once the break occurred, DAX was expected to target the Equal Legs area of 25274.27–25062.60, measured from waves ((a))–((b)).
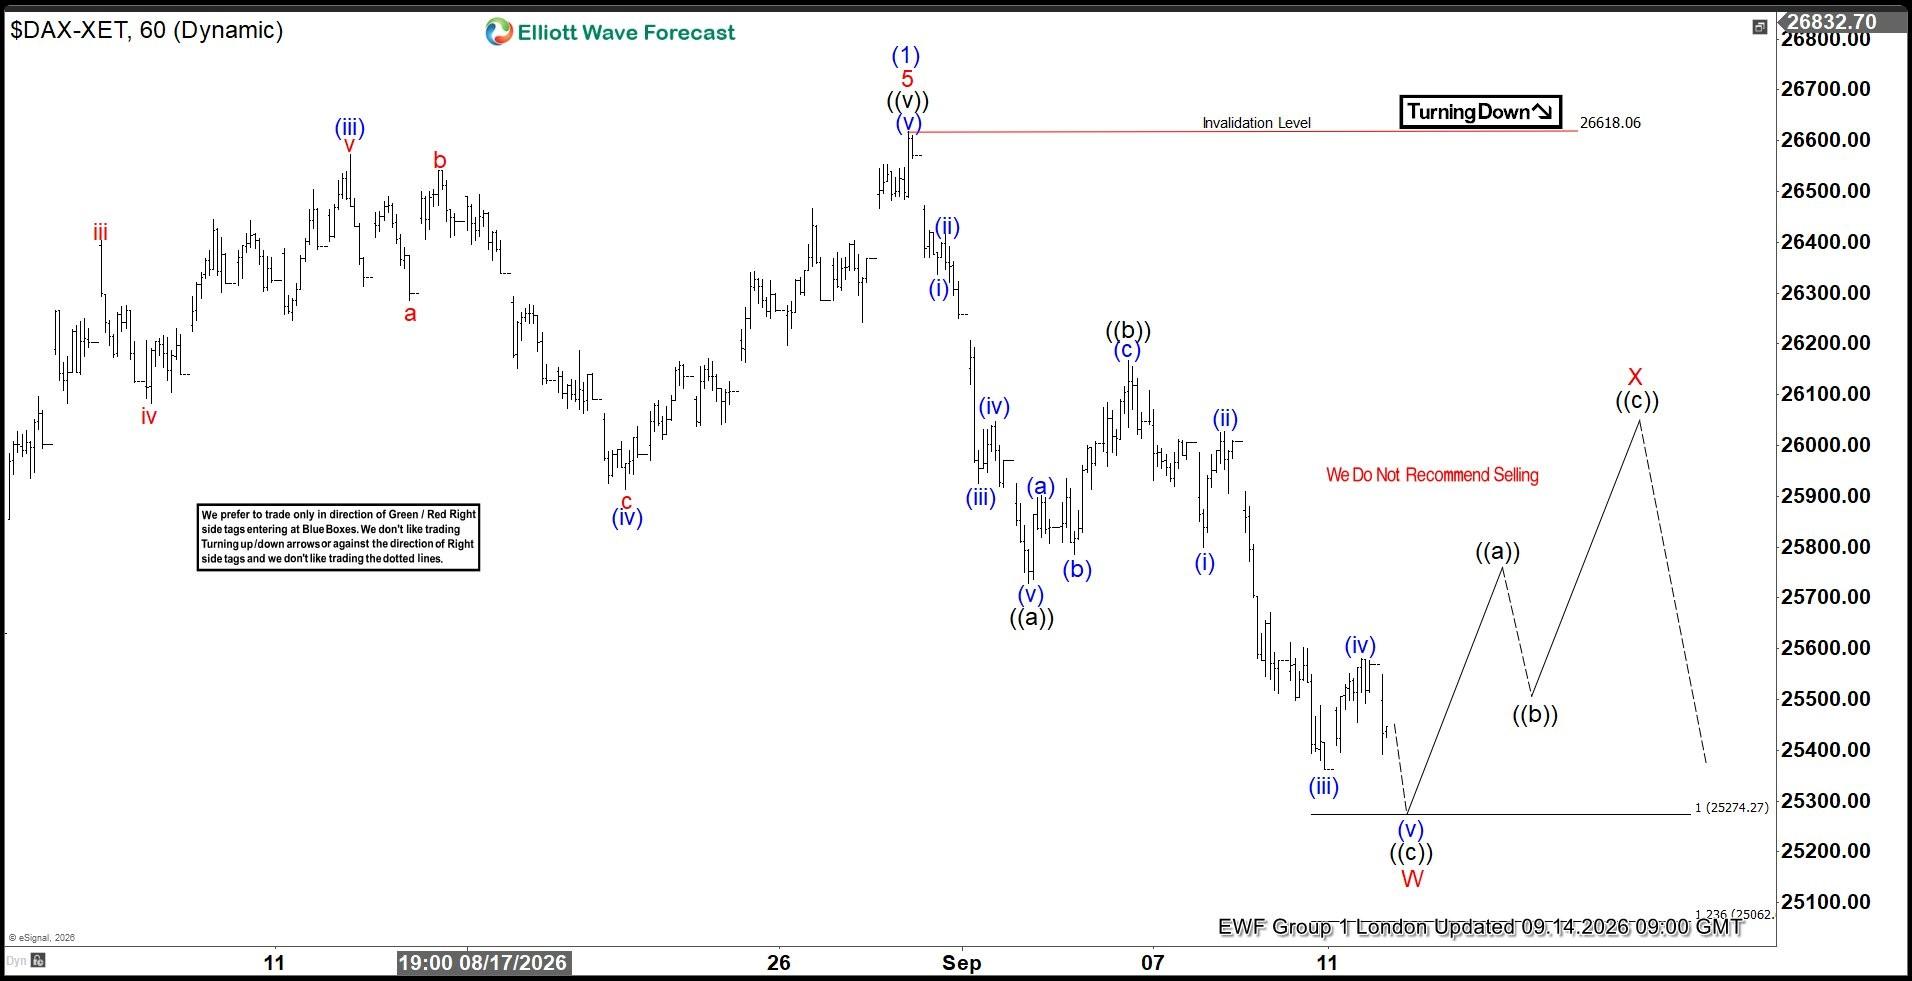
DAX one-hour Elliott Wave analysis 09.14.2026
DAX broke below the previous low and resumed the decline as expected. The price then moved toward our target area at 25274.27–25062.60. We expected the Zig Zag correction to complete in this area. We also expected buyers to step in from the zone and trigger a three-wave bounce, at least in the short term.
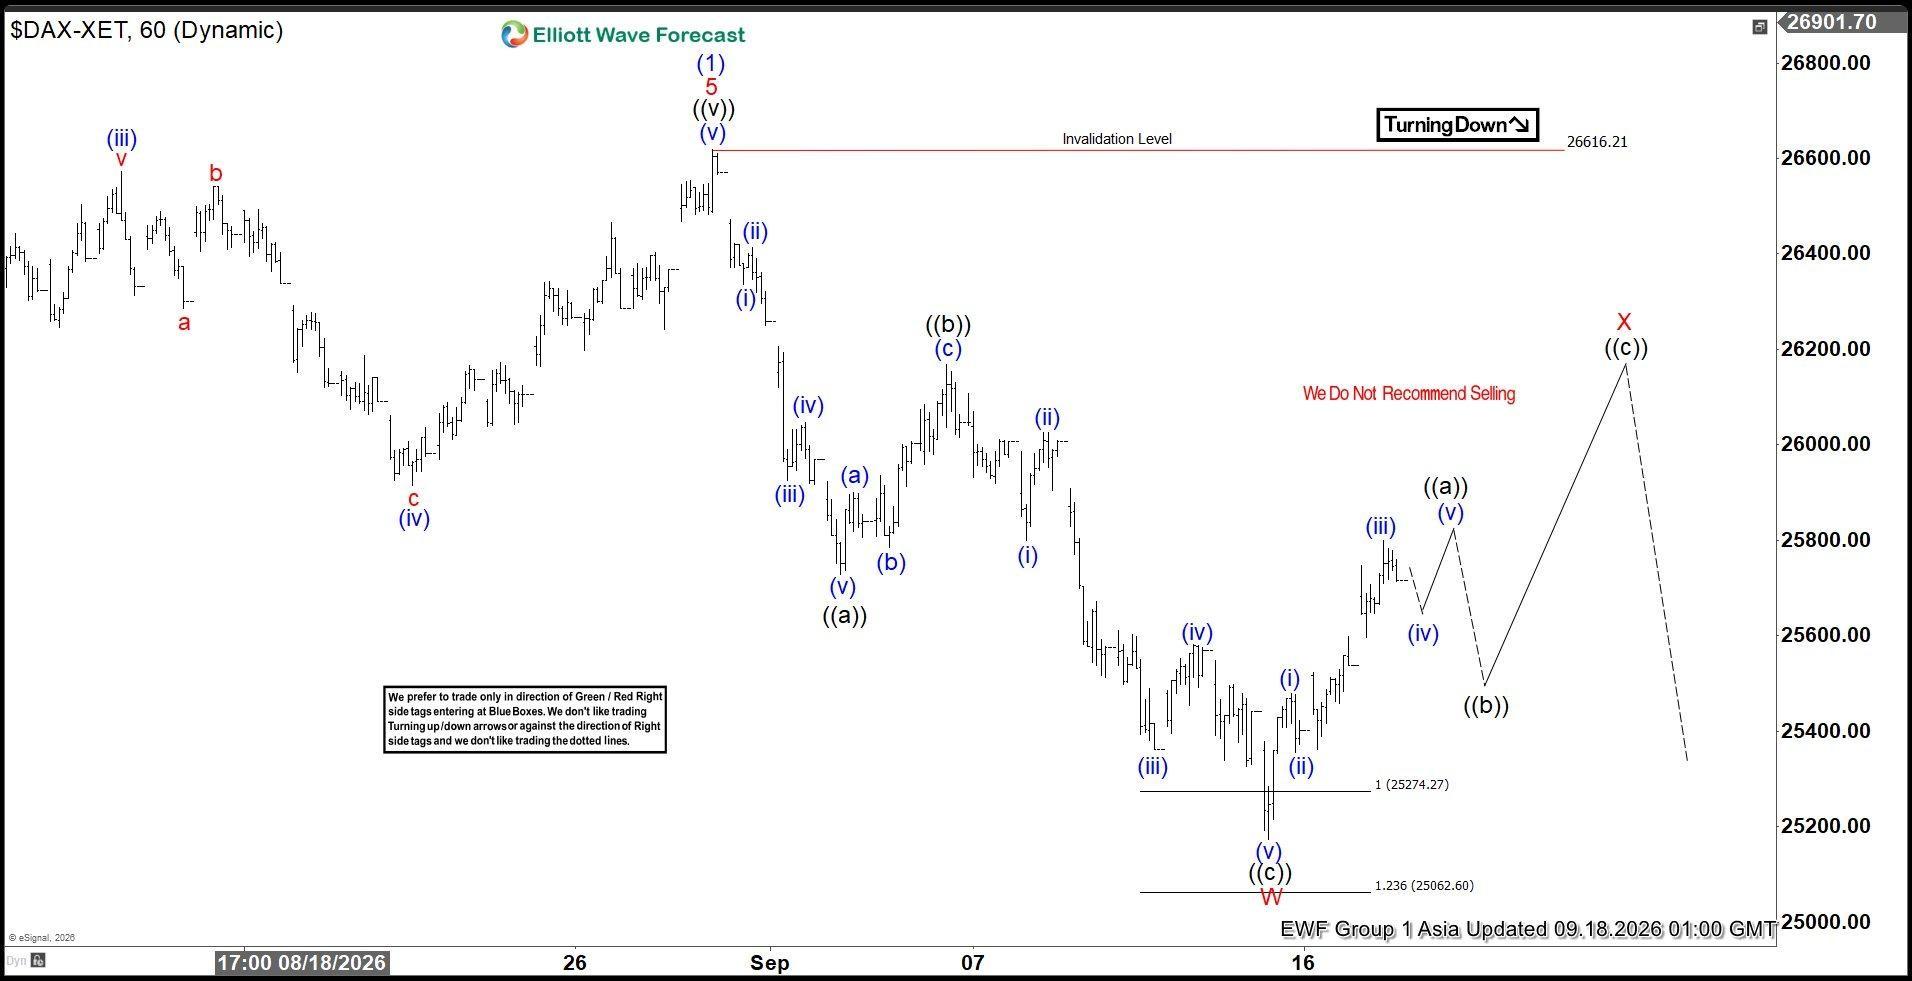
DAX one-hour Elliott Wave analysis 09.14.2026
Buyers stepped in right at the Equal Legs area at 25274.27–25062.60, as expected. The Zig Zag pattern completed, and DAX then started a wave X red recovery against the 26616.21 peak.
Author

Elliott Wave Forecast Team
ElliottWave-Forecast.com














