Crude Oil shrugs as Trump threatens war over a helicopter
- Crude Oil fell on Tuesday even after Trump threatened to retaliate against Iran for shooting down a US Apache helicopter.
- The market is treating the overnight incident as noise against ongoing Strait of Hormuz reopening talks.
- Rising tanker traffic and fading ceasefire fears outweighed the escalation.

Trump announced on Tuesday that his military had concluded Iran shot down one of its Apache helicopters over the Strait of Hormuz during the overnight session, and that the US had no choice but to respond. Crude Oil's reaction was to fall. That single fact tells you most of what you need to know about where the market's head is right now: traders have stopped trading the war and started trading the deal to end it.
A war threat priced as a rounding error
The setup looked combustible on paper. Two US aviators were pulled from the water beside the world's most important oil chokepoint, the President publicly blamed Tehran, and Iran's foreign minister fired back that foreign forces loitering near Iranian territory should not be surprised when accidents happen, and would be wise to leave. A few months ago that exchange would have stuffed a double-digit premium into the barrel. Instead, WTI handed back the previous session's gains and drifted lower through the day. The bid that did arrive on the headline lasted minutes, not hours, before sellers reclaimed it.
Hormuz is the only story that matters
The reason for the indifference is simple. The market has stopped pricing escalation and started pricing the off-ramp. Ship traffic through the Strait of Hormuz has been picking up materially as Washington and Tehran inch toward a framework that would reopen the waterway, and the US Dollar softened on the same hopes. With roughly a fifth of seaborne Crude Oil normally moving through the strait, the reopening trade is worth more to the tape than any single helicopter. As long as the negotiating track survives, every geopolitical flare gets sold into rather than chased. The skeptical read is that the market is pricing a deal that has not actually been signed, and is therefore one genuine retaliation away from a nasty repricing.
Buyers rented the spike, then handed it back
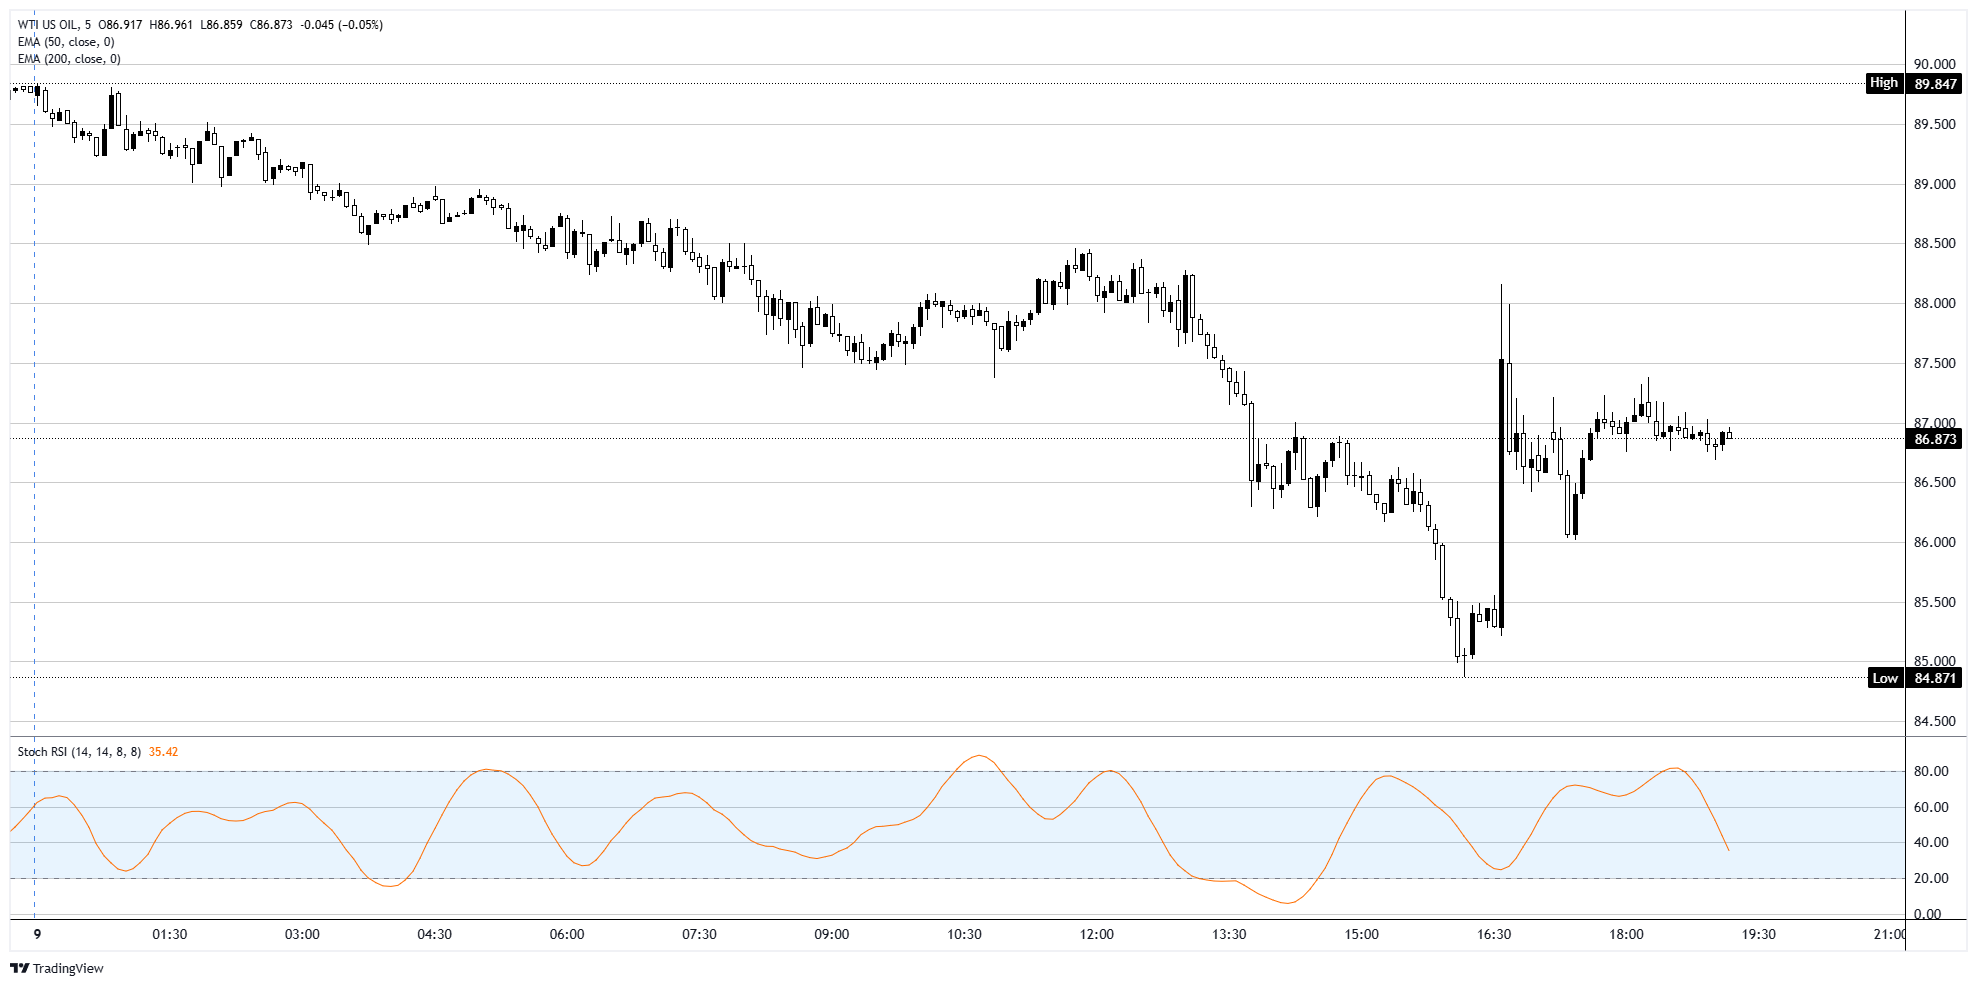
On the chart, Tuesday was a controlled bleed. WTI slid from just shy of $90 at the open down to a session low close to $85, a clean one-way move that flushed out the late longs. The Apache headline then produced a violent vertical candle toward $88, the kind of knee-jerk geopolitical bid that looks terrifying on a five-minute screen and means nothing an hour later. It was sold almost immediately, with price snapping back into the $86.50 to $87.00 zone and chopping sideways there into the close near $87. The Stochastic Relative Strength Index (Stoch RSI) rolled over from overbought back toward the middle of its range, confirming that the momentum behind the spike has already drained.
Levels to watch
Upside: a reclaim of the $88 spike high reopens the run toward the session high near $90, though it likely needs a real catalyst, an actual US strike or the Hormuz talks collapsing, rather than rhetoric alone.
Downside: losing the $86.50 shelf puts the session low near $85 back in play, and a clean break there reopens the broader slide.
Bias: neutral and choppy with a soft downward tilt. Until Hormuz physically reopens or the war genuinely restarts, the playbook is to fade the war-premium spikes and lean against rallies, respecting the $85 to $88 range.
WTI spot, 5-minute chart
WTI Oil FAQs
WTI Oil is a type of Crude Oil sold on international markets. The WTI stands for West Texas Intermediate, one of three major types including Brent and Dubai Crude. WTI is also referred to as “light” and “sweet” because of its relatively low gravity and sulfur content respectively. It is considered a high quality Oil that is easily refined. It is sourced in the United States and distributed via the Cushing hub, which is considered “The Pipeline Crossroads of the World”. It is a benchmark for the Oil market and WTI price is frequently quoted in the media.
Like all assets, supply and demand are the key drivers of WTI Oil price. As such, global growth can be a driver of increased demand and vice versa for weak global growth. Political instability, wars, and sanctions can disrupt supply and impact prices. The decisions of OPEC, a group of major Oil-producing countries, is another key driver of price. The value of the US Dollar influences the price of WTI Crude Oil, since Oil is predominantly traded in US Dollars, thus a weaker US Dollar can make Oil more affordable and vice versa.
The weekly Oil inventory reports published by the American Petroleum Institute (API) and the Energy Information Agency (EIA) impact the price of WTI Oil. Changes in inventories reflect fluctuating supply and demand. If the data shows a drop in inventories it can indicate increased demand, pushing up Oil price. Higher inventories can reflect increased supply, pushing down prices. API’s report is published every Tuesday and EIA’s the day after. Their results are usually similar, falling within 1% of each other 75% of the time. The EIA data is considered more reliable, since it is a government agency.
OPEC (Organization of the Petroleum Exporting Countries) is a group of 12 Oil-producing nations who collectively decide production quotas for member countries at twice-yearly meetings. Their decisions often impact WTI Oil prices. When OPEC decides to lower quotas, it can tighten supply, pushing up Oil prices. When OPEC increases production, it has the opposite effect. OPEC+ refers to an expanded group that includes ten extra non-OPEC members, the most notable of which is Russia.
Author

Joshua Gibson
FXStreet
Joshua joins the FXStreet team as an Economics and Finance double major from Vancouver Island University with twelve years' experience as an independent trader focusing on technical analysis.