Crude Oil rolls over as a US-Iran deal moves within hours
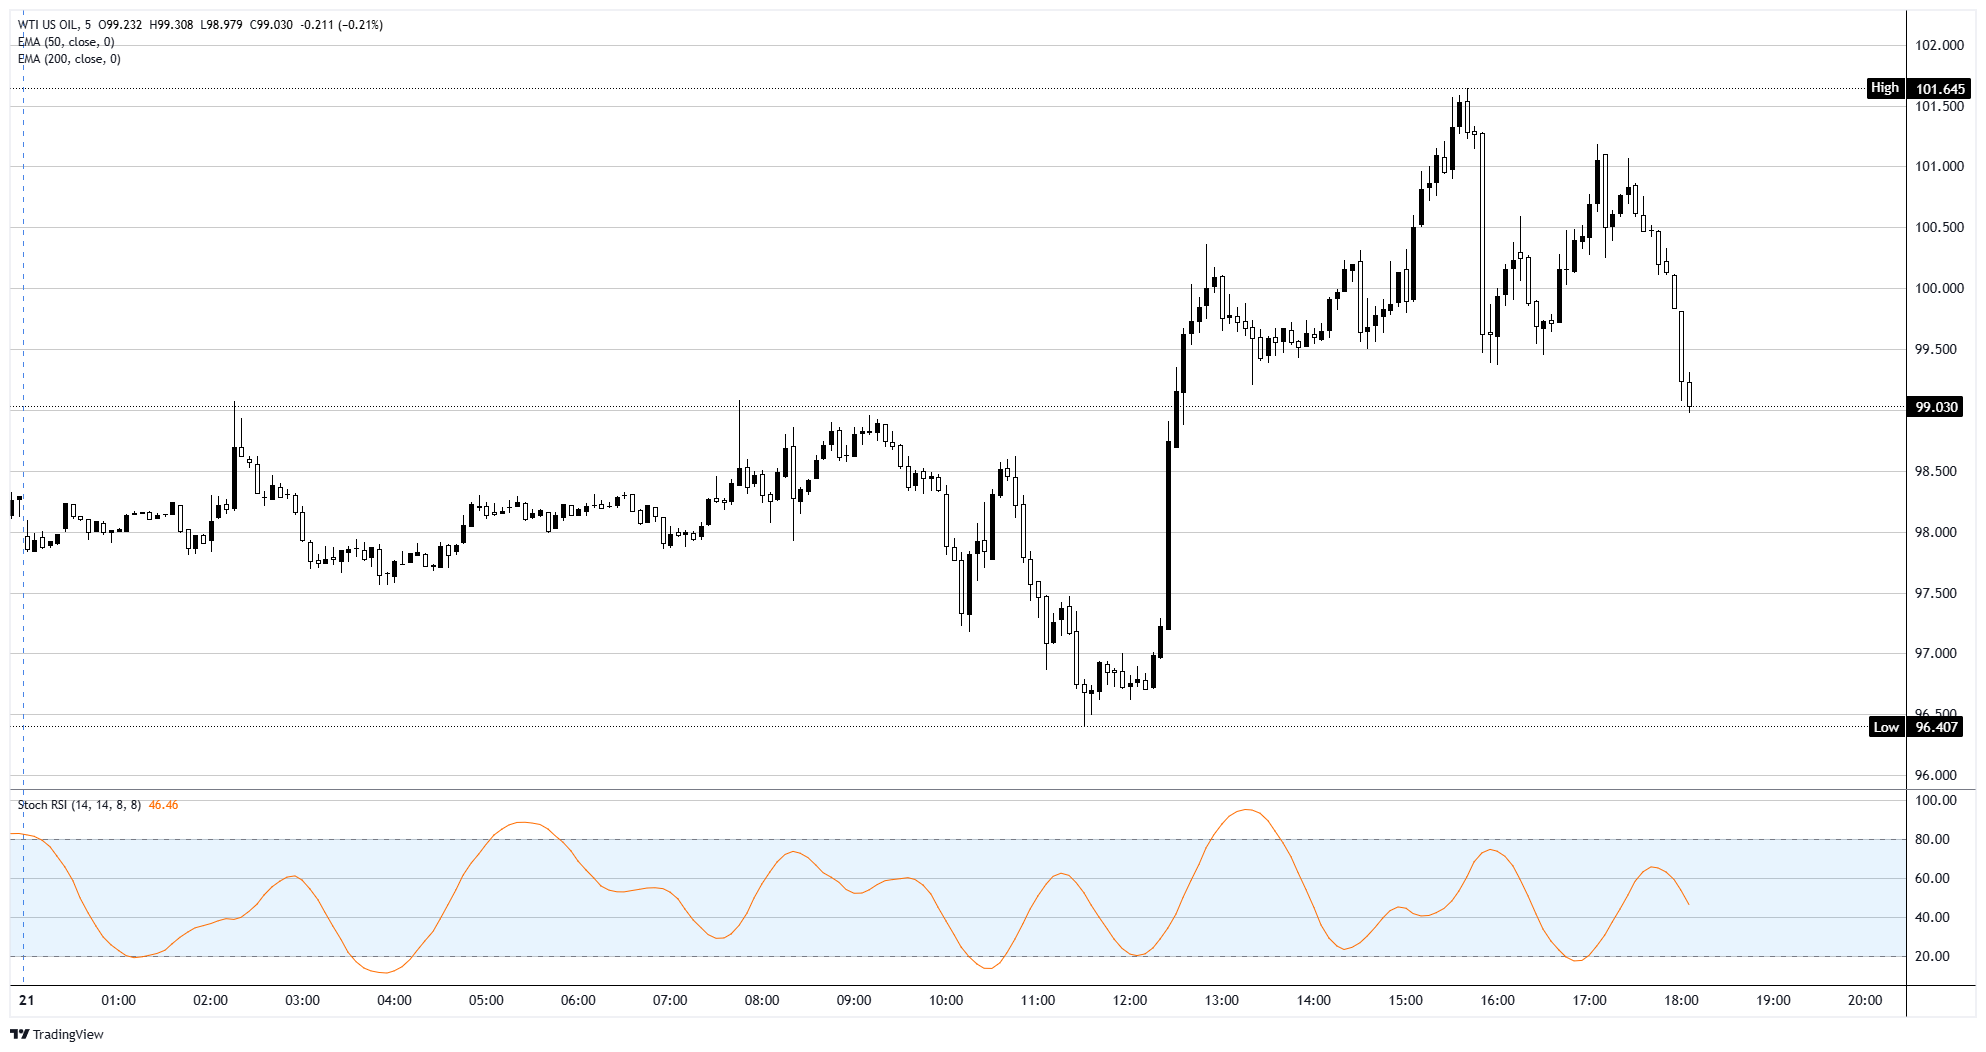
- WTI spiked above $101 during the session before rolling over, sliding back below the $100 mark as reports landed that a final US-Iran agreement could be announced within hours.
- The de-escalation trade is back. A deal that reopens the Strait of Hormuz would unwind the war premium that has propped up Oil for three months.
- Skepticism is warranted given how many deadlines have already slipped, but the tape is voting with the doves, and momentum has rolled over from overbought.

Crude spent most of Thursday doing what it has done all spring, rallying on the latest escalation headline, this time the claim that Iran would keep its enriched uranium at home. Then the wires flipped. Iranian state media, citing Al Arabiya, reported that a final draft of a US-Iran agreement had been reached with Pakistani mediation and could be announced within hours. Oil promptly handed back the day's gains, fading from a session high above $101 to slip back under $100 at the time of writing. That single reversal tells you everything about what is actually pinned under this market. The bid was never about barrels. It was about a closed waterway, and the news now points toward that waterway reopening.
The premium that built the rally is the premium most at risk
For three months the floor under Crude has been the Strait of Hormuz, the chokepoint for close to a fifth of the world's seaborne Oil, throttled since late February. Every dip has been bought on the assumption that the conflict stays frozen and the strait stays shut. A genuine deal breaks that assumption. The reporting that landed Thursday points to a comprehensive framework brokered by Pakistan, with Saudi Arabia publicly pushing for navigation through the strait to be restored to its pre-February state. If that happens, the supply fear evaporates, and so does most of the reason anyone is paying triple digits for WTI. The market is starting to price that, which is why a fresh escalation headline could not hold the high.
But the desk has seen this movie before
Here is the catch, and it is a big one. This is not the first time a deal has been hours away. Deadlines came and went in March and April, ceasefires were declared and then violated, and even now the mediators briefing reporters describe what is on the table as an agenda for talks rather than a signed deal. Tehran and Washington remain far apart on the length of any nuclear freeze. Pakistan's army chief is reportedly flying to Tehran precisely because the gap still needs closing. So the move lower in Oil is the market front-running a headline, not a done deal. If the announcement slips again, or arrives watered down, the war premium snaps straight back and Crude is back probing the highs.
How to trade a deal that may or may not exist
On the 4-hour chart, WTI has spent May trapped between the rising 200-period exponential moving average near the $95 to $96 region as support and the $104 to $105 swing highs as resistance, with the late-April peak near $107 capping the range. Thursday's intraday spike and rejection above $101 keeps that structure intact. The level that matters now is $100. A clean break below it, confirmed by a deal announcement, opens the door toward the $95 to $96 floor, and a strait that actually reopens could drag Crude toward the $90 area and lower over the following sessions, with some forecasters flagging $80 by year-end. Fail to confirm the deal, and the $104 to $105 band comes back into play fast. Momentum has already rolled over from overbought, leaning bearish into the headline. The skeptic's framework is simple: sell the rallies while the deal narrative builds, but keep a hand on the stop, because this market has punished everyone who declared the war over too soon.
WTI 5-minute chart
WTI Oil FAQs
WTI Oil is a type of Crude Oil sold on international markets. The WTI stands for West Texas Intermediate, one of three major types including Brent and Dubai Crude. WTI is also referred to as “light” and “sweet” because of its relatively low gravity and sulfur content respectively. It is considered a high quality Oil that is easily refined. It is sourced in the United States and distributed via the Cushing hub, which is considered “The Pipeline Crossroads of the World”. It is a benchmark for the Oil market and WTI price is frequently quoted in the media.
Like all assets, supply and demand are the key drivers of WTI Oil price. As such, global growth can be a driver of increased demand and vice versa for weak global growth. Political instability, wars, and sanctions can disrupt supply and impact prices. The decisions of OPEC, a group of major Oil-producing countries, is another key driver of price. The value of the US Dollar influences the price of WTI Crude Oil, since Oil is predominantly traded in US Dollars, thus a weaker US Dollar can make Oil more affordable and vice versa.
The weekly Oil inventory reports published by the American Petroleum Institute (API) and the Energy Information Agency (EIA) impact the price of WTI Oil. Changes in inventories reflect fluctuating supply and demand. If the data shows a drop in inventories it can indicate increased demand, pushing up Oil price. Higher inventories can reflect increased supply, pushing down prices. API’s report is published every Tuesday and EIA’s the day after. Their results are usually similar, falling within 1% of each other 75% of the time. The EIA data is considered more reliable, since it is a government agency.
OPEC (Organization of the Petroleum Exporting Countries) is a group of 12 Oil-producing nations who collectively decide production quotas for member countries at twice-yearly meetings. Their decisions often impact WTI Oil prices. When OPEC decides to lower quotas, it can tighten supply, pushing up Oil prices. When OPEC increases production, it has the opposite effect. OPEC+ refers to an expanded group that includes ten extra non-OPEC members, the most notable of which is Russia.
Author

Joshua Gibson
FXStreet
Joshua joins the FXStreet team as an Economics and Finance double major from Vancouver Island University with twelve years' experience as an independent trader focusing on technical analysis.

















