Crude Oil bounces on a Hormuz scare it doesn't believe
- Crude Oil bounced on Thursday after a tanker attack in the Gulf of Oman, then faded back toward pre-war levels.
- The attack pushed the UN's maritime agency to pause an evacuation of thousands of sailors stranded near the Strait of Hormuz.
- Record tanker traffic through the Strait and a building supply glut remain the dominant pressure on price.

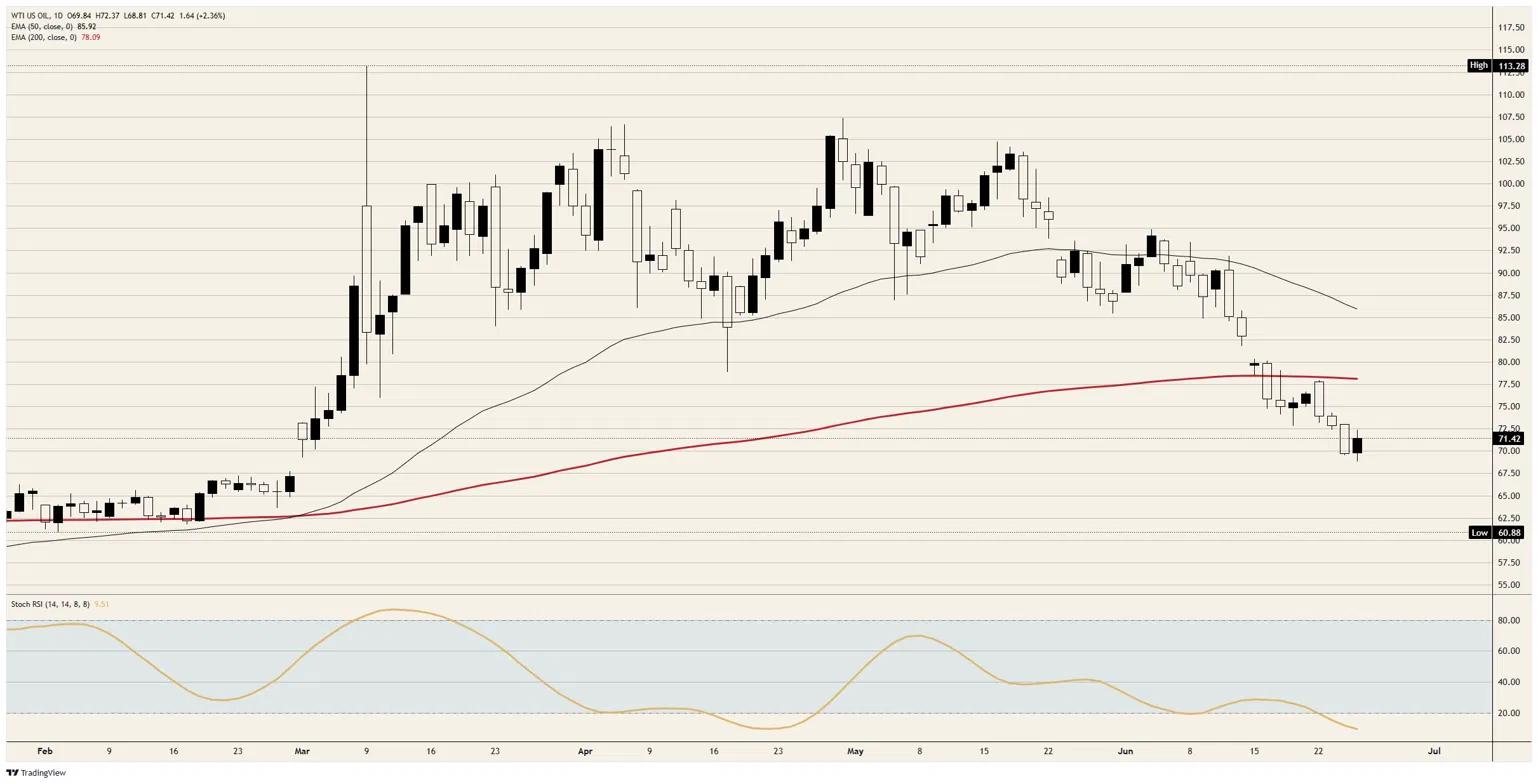
West Texas Intermediate (WTI) spent Thursday doing its now-familiar trick of grabbing a geopolitical bid and then quietly handing most of it back. A fresh tanker attack in the Gulf of Oman, paired with a decision by the United Nations to halt the evacuation of stranded sailors, lit a bounce of roughly 2.3% off a low near $69.00 to a high around $72.50, before the move faded into the close near $71.50. The honest label for the session is a reflexive fear bid that the tape promptly sold into. Crude Oil is still trading within a whisker of where it sat before the war began, which tells you how little the market now fears the Strait of Hormuz.
The Strait flares, the premium twitches
The trigger was an attack on a container ship in the Gulf of Oman, the latest reminder that the 60-day truce reopening the waterway is held together with tape and goodwill. In response, the International Maritime Organization (IMO) paused its plan to evacuate roughly 11K mariners still stuck near the Strait, saying it needed to reconfirm safety guarantees before sending anyone through. Iran's strait authority then repeated its threat that vessels straying from Tehran-approved lanes would face consequences, deliberately vague and deliberately ominous.
Layer in the unresolved fight over transit tolls, with Tehran wanting to charge for passage and Washington threatening a counter-toll, and you have a ceasefire that could fray on any headline. That is exactly the kind of backdrop that should keep a war premium firmly bid. It did, for about six hours.
The glut has the wheel
The reason that bid keeps leaking out is sitting in the shipping data. Tankers are now moving through the Strait at the fastest wartime pace yet, with a single-day record of about 16 million barrels set earlier in the week that surpassed even pre-war volumes, while Saudi cargoes steam toward Ras Tanura to restart Gulf exports for the first time since March. A temporary US waiver clearing the purchase of already-loaded Iranian barrels only adds to the wave of supply now hitting the water.
The structural signal is louder still. Brent's prompt spread flipped into bearish contango this week, the first such move since the conflict began; that is the market's way of saying near-term supply is no longer scarce. Traders are openly repositioning for a 2026 glut, as a major exporter threatens to break ranks over production quotas. The lone bullish footnote is Cushing, where inventories near 19 million barrels sit below comfortable operating levels, but a thin storage hub is small comfort against a Gulf that is reopening for business.
The inflation irony nobody is pricing
There is a neat irony buried in Thursday's other headline. The Personal Consumption Expenditures (PCE) price index, the inflation gauge the Federal Reserve (Fed) watches most closely, printed at 4.1% YoY for May, the hottest reading since 2023, with the core measure at 3.4%. Both landed roughly in line with forecasts, and the energy spike from the Hormuz war was a primary driver of that surge.
The catch is that the same de-escalation now gutting Crude Oil is quietly defusing the energy-driven inflation impulse that has kept the Fed leaning hawkish. May's data is backward-looking, and the barrel that fed it already sits more than $40 below its wartime peak near $113. A roughly in-line monthly print also took a little starch out of the Dollar on the day, handing Crude's bounce a small mechanical assist it did not earn on its own.
Where to fade it
Resistance: The first ceiling is Thursday's high near $72.50, the level the bounce died at. Above it, sellers should reload toward $75.00, and only a reclaim of the 200-period Exponential Moving Average (EMA), now near $78.00, would force a rethink of the broader downtrend.
Support: The line to watch is the $69.00 area, with Thursday's spike low just beneath it. A clean break there opens the door to the high-$60s and a full round-trip to pre-war levels, where the chart last found a floor.
Bias: Lower. The Stochastic Relative Strength Index (Stoch RSI) is buried near the bottom of its range on the daily chart, so another oversold bounce is possible, but every rally into resistance is a fade until the Strait of Hormuz genuinely re-closes rather than merely flickers. The glut is the trend; the war premium is the noise.
WTI Spot daily chart
WTI Oil FAQs
WTI Oil is a type of Crude Oil sold on international markets. The WTI stands for West Texas Intermediate, one of three major types including Brent and Dubai Crude. WTI is also referred to as “light” and “sweet” because of its relatively low gravity and sulfur content respectively. It is considered a high quality Oil that is easily refined. It is sourced in the United States and distributed via the Cushing hub, which is considered “The Pipeline Crossroads of the World”. It is a benchmark for the Oil market and WTI price is frequently quoted in the media.
Like all assets, supply and demand are the key drivers of WTI Oil price. As such, global growth can be a driver of increased demand and vice versa for weak global growth. Political instability, wars, and sanctions can disrupt supply and impact prices. The decisions of OPEC, a group of major Oil-producing countries, is another key driver of price. The value of the US Dollar influences the price of WTI Crude Oil, since Oil is predominantly traded in US Dollars, thus a weaker US Dollar can make Oil more affordable and vice versa.
The weekly Oil inventory reports published by the American Petroleum Institute (API) and the Energy Information Agency (EIA) impact the price of WTI Oil. Changes in inventories reflect fluctuating supply and demand. If the data shows a drop in inventories it can indicate increased demand, pushing up Oil price. Higher inventories can reflect increased supply, pushing down prices. API’s report is published every Tuesday and EIA’s the day after. Their results are usually similar, falling within 1% of each other 75% of the time. The EIA data is considered more reliable, since it is a government agency.
OPEC (Organization of the Petroleum Exporting Countries) is a group of 12 Oil-producing nations who collectively decide production quotas for member countries at twice-yearly meetings. Their decisions often impact WTI Oil prices. When OPEC decides to lower quotas, it can tighten supply, pushing up Oil prices. When OPEC increases production, it has the opposite effect. OPEC+ refers to an expanded group that includes ten extra non-OPEC members, the most notable of which is Russia.
Author

Joshua Gibson
FXStreet
Joshua joins the FXStreet team as an Economics and Finance double major from Vancouver Island University with twelve years' experience as an independent trader focusing on technical analysis.