Crowdstrike is up 59% since April and running right into a trendline from 2021

CrowdStrike Holdings (CRWD) has pushed up over 59% since the week of April 6th, and the rally has been driven by a story that is going to keep getting attention. Artificial intelligence agents are being used to compromise banking platforms, and the banks are responding by signing new agreements with cybersecurity firms to make sure they are not on the hook for any breach. This intrusion is only the start. As AI continues to develop, bad actors will keep finding new ways to weaponize it, and that demand for enterprise-grade cybersecurity is only growing.
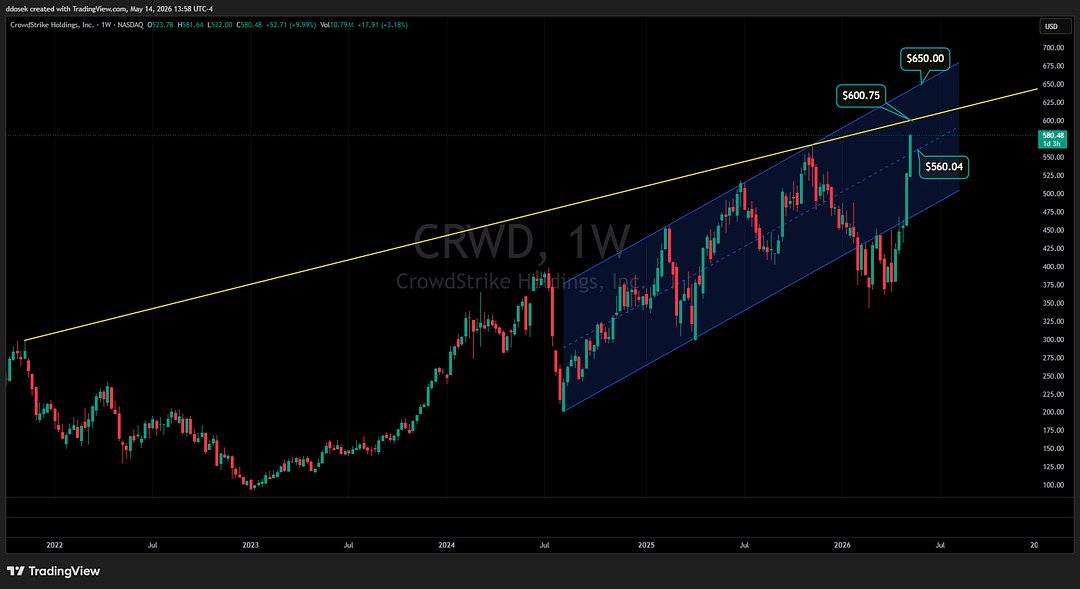
With that said, let’s jump into the CRWD chart. On the weekly timeframe, the rally is now running directly into a major technical level that demands attention. An inclining yellow trendline that originates from a pivot back in 2021 currently sits at $600.75. That trendline was tested back in November of 2025 and rejected the move at that time.
Price is now accelerating right back into the same level, and on the second touch of a multi-year trendline, probabilities generally favor at least some consolidation or a pullback before a breakout can develop.
The buyers who have controlled this chart since the April lows have done so with conviction. A 59% move in roughly six weeks does not happen without committed institutional buying. The sellers who defended the trendline back in November are likely to make another stand on this approach, and the combination of an extended move with a major resistance level overhead typically produces a digestion phase before the next leg.
If CRWD does pull back from the trendline, the first level to watch is the most aggressive entry at the previous pivot high from November at $566.90. Just below that, the 50% midline of the inclining parallel channel sits at $560.04, which creates a solid support zone.
The trigger that shifts the probabilities in favor of a continued push higher is a confirmed weekly close above $600.75. Clearing the trendline with conviction sets up the next leg toward the top of the parallel channel at $650.00. That kind of breakout would also flip the trendline that rejected price in November from resistance into support.
The thesis breaks on a weekly close back below $560.04. A move below the 50% midline of the parallel channel would invalidate the recent recovery structure.
The trendline is the test. The cybersecurity story clearly has momentum but the chart is at a level that has rejected price before. The next several weekly closes will tell traders whether this is the breakout that finally clears the 2021 trendline or another rejection at the same wall.
Author

Drew Dosek
Verified Investing
Passionate technical and cycle analyst committed to empowering traders through data-driven insights.

















