CENX honoring topping tail — The chart has levels on both sides worth knowing

Century Aluminum (CENX) is a primary aluminum producer with operations across the United States and Europe. The stock price has swung back and forth between slightly up to slightly down this morning. But CENX made a significant run from its late March lows near $46 all the way up to the $68–$69 area in early April. This is where a valid topping tail was put in with a bearish rejection at the highs.
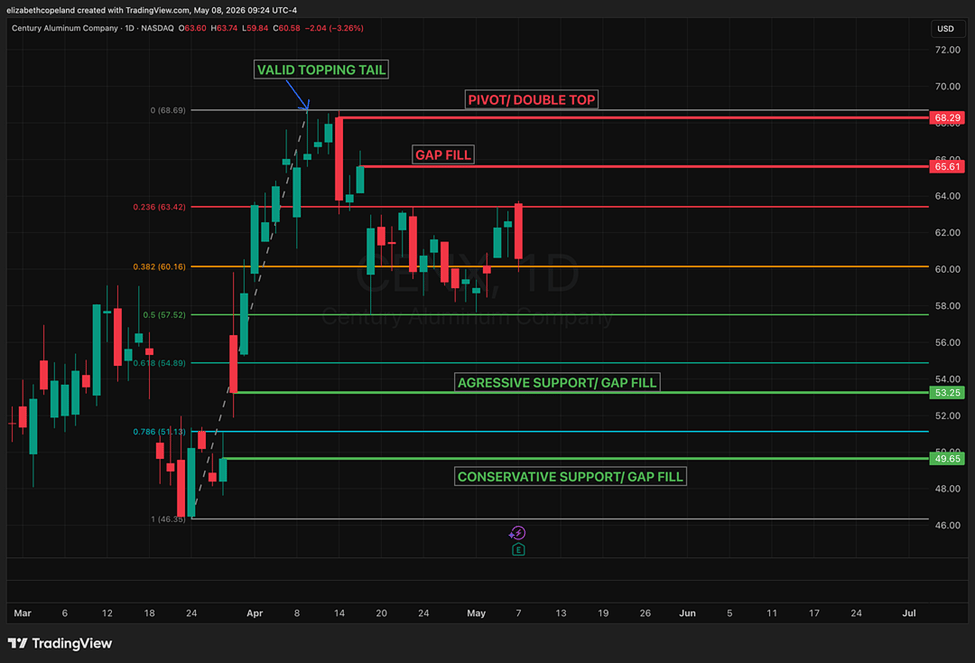
CENX has been working its way lower ever since. The chart has clearly defined levels on both the downside and the upside. Just a note… I’d like a bigger drop before trying to buy something near highs.
Let’s start with where price is heading if the selling continues. The first area worth watching for a bounce is the gap fill at $53.25. This is approximately 10-11% below current price. Aggressive traders can look for an entry there, with the understanding that this level sits closer to the recent highs than the lows. Like I said, this limits how much conviction I would put behind a longer-term hold from that zone. An intraday reaction is possible. A sustained multi-day bounce from $53.25 is less certain given where we are in the range. Keep position size appropriate to that reality.
Below the aggressive gap fill, the .786 Fibonacci retrace sits at $51.13 which coincides with a pivot. Just under it is the conservative gap fill at $46.65. That level, sitting just below the Fib retrace, is where the higher-probability bounce setup lives. The combination of the Fibonacci level and the gap fill in the same area gives $46.65 more technical weight than the $53.25 level above it.
Now the short side, which is where my preference sits on this chart. If CENX pops from current levels, two resistance areas above are where I would rather be positioned short near highs. The gap fill at $65.61 is the first. Price is about 8% away from that level right now, and a bounce back toward it sets up a short entry.
Above that sits the double top and pivot high zone at $68.29. This is the same area where the topping tail formed in early April with the all-time high above that. The way I would manage risk would be a tight stop above all-time high levels, since a breakout then turns this chart bullish.
Author

Elizabeth Copeland
Verified Investing
Elizabeth is a trader and financial journalist who uses her sharp analytical skills to spot market shifts early and trade with precision.


