CEG earnings and CPI/PPI this week will test S&P 500’s resilience

As another trading week begins, the S&P 500 and Nasdaq are back at all-time highs, with recent candles still closing near their highs rather than fading into the close.
The bullish pressure is hard to ignore, but the mood is not exactly clean euphoria either. A lot of traders are bullish because of AI and mega-cap tech earnings, while another group is already actively shorting what they think is the top.
The market has already digested a lot of war noise, but it now has to deal with another round of inflation data and AI-linked earnings.
What’s in it for traders this week
- Constellation Energy (CEG) reports Q1 results on May 11, giving traders another read on the AI power-demand story.
- CPI is due on May 12, while PPI follows on May 13, which should matter more now because oil-driven inflation risk is still hanging around the market.
US market conditions recap (May 11th, 2026)
Since March 30th, 2026, the S&P 500 has rallied for 29 trading days.
This rally is clearly led by the tech sector, which is currently boosted by the AI sector. While it’s possible that there is still room to go, it’s undeniable that the current rally is extremely tech-heavy.
This means S&P’s rally is heavily supported by AI earnings, and the market appears to have digested war risks; especially since the ceasefire proposal starting from April 8th (despite no real conclusive resolution).
S&P 500, Nasdaq 100, tech the big winners in last two-months
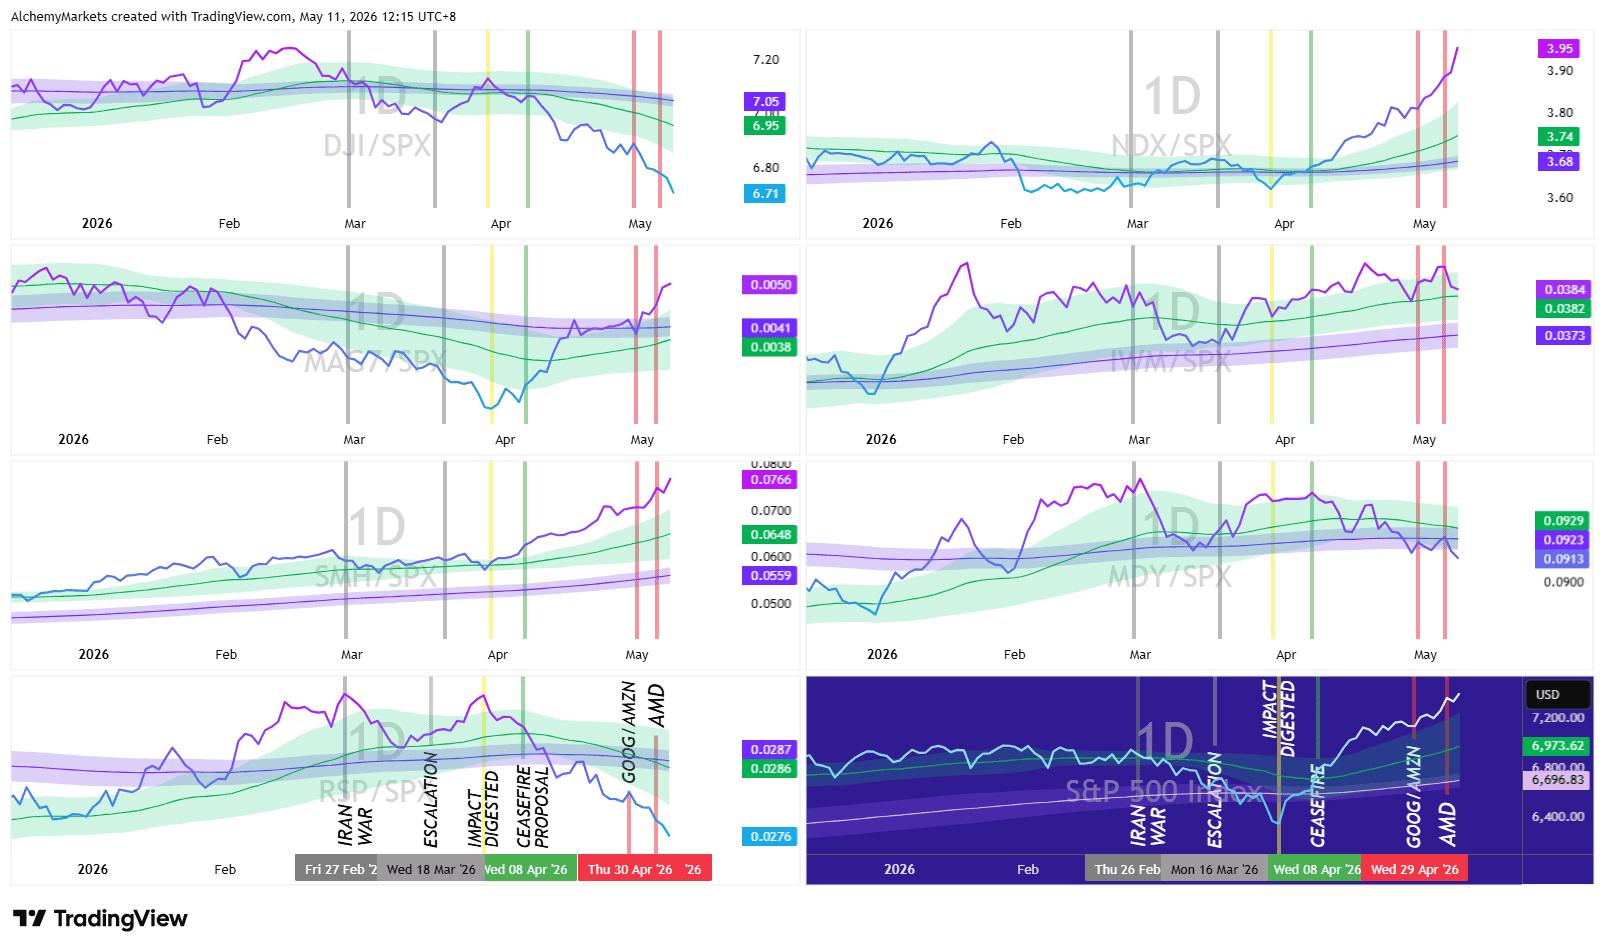
This is a US index comparison chart against the S&P 500. An overview like this can help us contextualise what the markets currently care about. And newsflash: it’s AI growth and earnings.
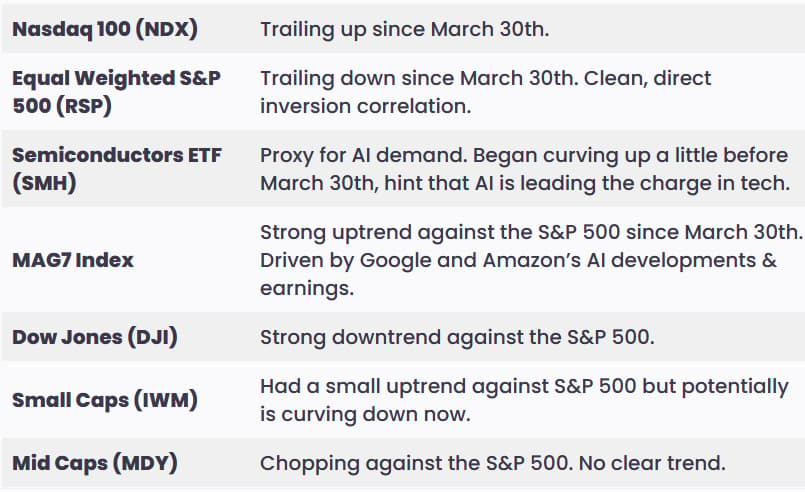
The Nasdaq and MAG7 are currently the strongest drivers of the S&P 500, with AI demand (displayed via the SMH index) clearly leading the charge. By contrast, the RSP, Small Caps, Mid Caps, and Dow Jones are the biggest losers.
For now, the action plan is clear — remain cautiously bullish until the trend breaks.
Catalysts this week would be constellation Q1 earnings to maintain a bullish outlook on AI earnings, followed by CPI and PPI readings to gauge how sticky inflation is.
Markets don’t really care about war risks (for now)
Despite a messy news cycle surrounding the US-Iran war, it is clear that markets have not reacted to war risks all that much.
At a glance, the price chart tells a simple story: war risks have likely been digested, and markets seem increasingly willing to lean on ceasefire optimism, strong economic resilience, and continued AI-led momentum instead.
Since the US-Iran War began in February, the news cycle surrounding peace talks has flip-flopped constantly.
A breakdown looks like this:
- Escalations: Around 7–8 key events.
- De-escalations: Around 3–4 relief events.
What matters here is not whether every war headline was bullish or bearish. It clearly was not. But the chart still tells us that markets have mostly digested the risk.
Equities are not ignoring the war because the risk is irrelevant. They are fading it because the current damage has not yet beaten the AI earnings story. But if oil breaks higher, yields reprice, or inflation expectations move again, the same market that looked calm can suddenly rush to price the risk all at once.
S&P 500 trend: Still bullish, but potential overstretched
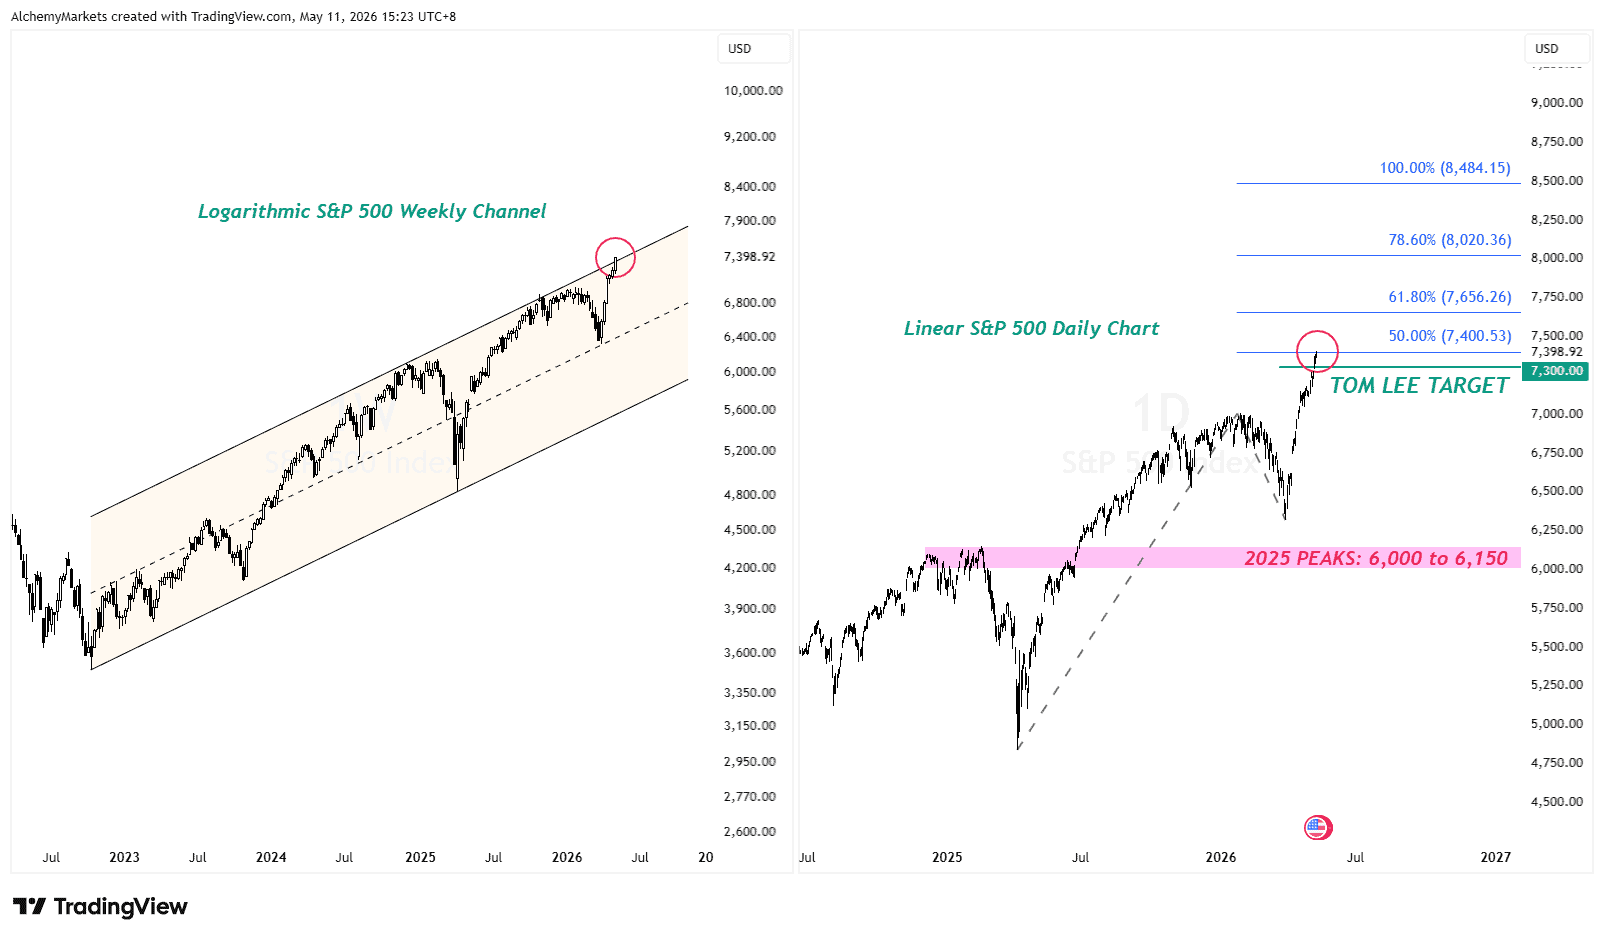
The S&P 500 is now pressing into the $7,400 area, yet another all-time high. This is one of the fastest rallies in S&P 500’s history, marked by a combination of war fears, and positive AI earnings.
On the weekly logarithmic chart, the S&P 500 is slightly peeking out of a potential rising channel. The multiple reactions at the midline adds a degree of validity to the channel; but if the markets do not feel like respecting it, the S&P 500 can absolutely run higher.
However, if the markets are still respecting the channel, it does mean the index is overstretched.
On the linear chart, we have another confluence with another resistance — the 50% Fib extension level smack dab at $7,400.
If momentum continues, the next extension levels sit near $7,656, $8,020, and $8,484.
These are not guaranteed targets. They are reference zones if the trend keeps extending if AI keeps delivering.
Constellation Q1 earnings and chart analysis
Constellation Energy is not big enough to move the S&P 500 by itself, but it matters because of what it represents. The company is one of the largest weights inside the utilities sector, with roughly 6.9% weighting in XLU (utilities ETF), and has become one of the cleaner non-chip proxies for AI data-centre power demand.
So the earnings reaction is less about whether CEG alone can carry the index, and more about whether traders still want to pay a premium for the power side of the AI infrastructure trade.
Yahoo Finance lists Constellation’s forward P/E at around 26.6x, which supports the idea that the stock is no longer being priced like a plain utility. Rather, the stock is being priced as a proxy for AI power demand.
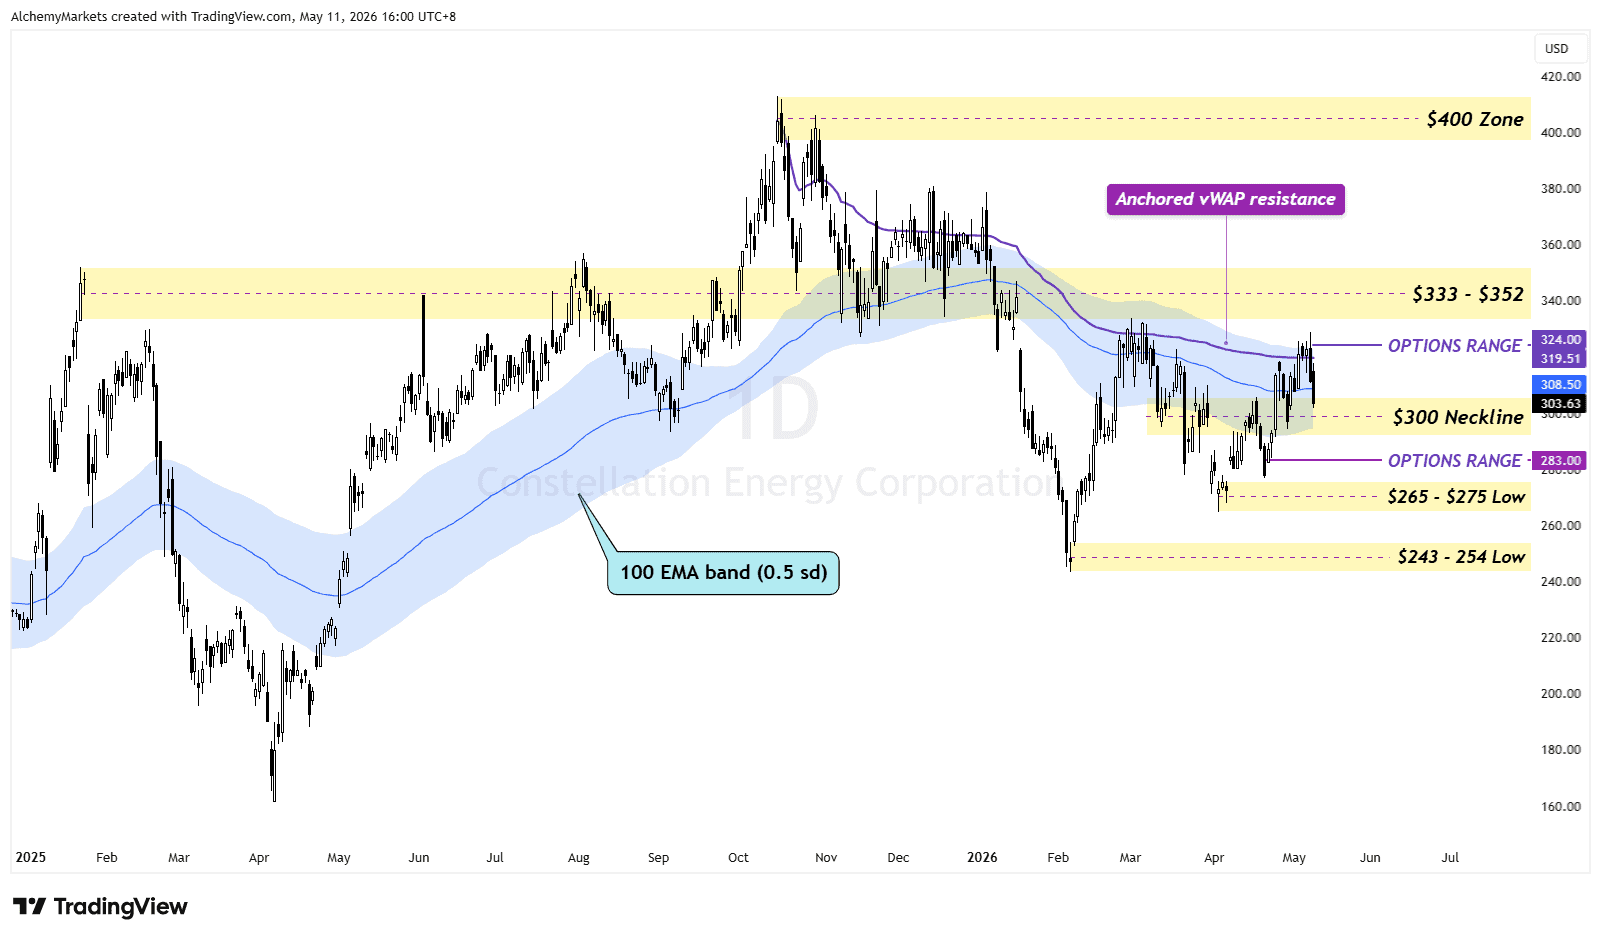
The stock is holding above its rising short-term trendline, while the $300 level — a neckline of a double bottom pattern that has already played out — remains the level bulls do not want to lose.
Above price, the $320 area is the first resistance to clear (marked by the anchored vWAP), followed by the wider $333-$352 zone, and then the $400 zone if earnings trigger a stronger upside reaction.
The options-implied move is 7%, which means an expected post earnings range of $283 to $324, based on last Friday’s close.
CEG metric | Q1 2026 expectation | Previous / prior value |
Adjusted EPS | Around $2.34-$2.61 depending on source | $2.30 in Q4 2025, |
Revenue | Around $8.21B-$9.00B depending on source | $6.07B in Q4 2025, |
FY2026 adjusted EPS guidance | $11-$12 | FY2025 adjusted operating EPS was $9.39 |
Options-implied move | Around 7% | Roughly $283-$324 range post-earnings |
Constellation’s Q1 earnings call is scheduled for May 11 at 10:00 AM ET, according to the company’s investor relations page.
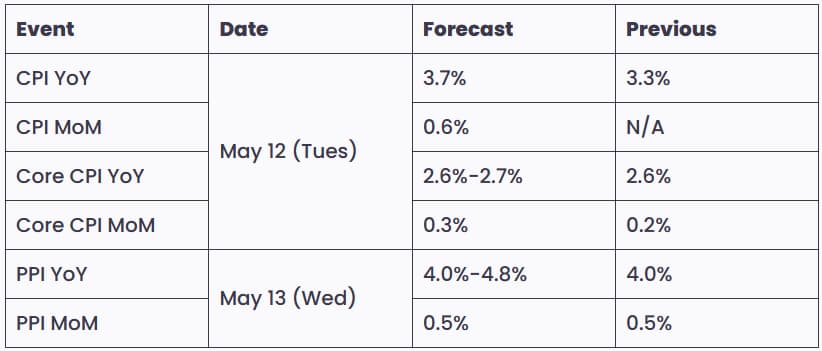
CPI and PPI on Tuesday and Wednesday
CPI is due on Tuesday, while PPI follows on Wednesday. Both releases matter more than usual because the market is entering the data with equities at highs, semiconductors stretched, and oil risk still hanging around in the background.
The BLS confirms that April CPI is scheduled for release on May 12 at 8:30 AM ET.
Meanwhile, the April PPI is scheduled for May 13 at 8:30 AM ET.
Bottom line: Cautiously bullish, but upside returns are increasingly more risky
For now, the trend still leans bullish. The S&P 500 and Nasdaq are at highs, AI-linked tech is still leading, and the strongest flows remain concentrated in Mag 7, semiconductors, and the broader AI infrastructure trade.
But the rally is top-heavy, and that means the upside now depends on a narrower set of confirmations:
- Constellation earnings tell us whether the AI power-demand story still has momentum.
- CPI and PPI tell us whether inflation risk is calm enough for equities to keep rallying.
- Oil and yields tell us whether the market is still right to fade war headlines.
Until those break, the trend still leans bullish. But if semiconductors roll over, inflation comes in hot, or oil starts dragging yields higher again, this rally can go from confident to fragile very quickly.
Author

Zorrays Junaid
Alchemy Markets
Zorrays Junaid has extensive combined experience in the financial markets as a portfolio manager and trading coach. More recently, he is an Analyst with Alchemy Markets, and has contributed to DailyFX and Elliott Wave Forecast in the past.


