Breaking: Canada headline CPI rose by 3% YoY in July

Canada’s inflation picked up pace in July, with the headline Consumer Price Index (CPI) rising 3% from a year earlier, above market expectations and up from the 2.8% increase recorded in June. On a monthly basis, prices rose 0.5%.
Meanwhile, the Bank of Canada’s (BoC) core measure, which excludes more volatile components such as food and energy, rose 2.3% over the past year and increased by 0.2% compared with the previous month.
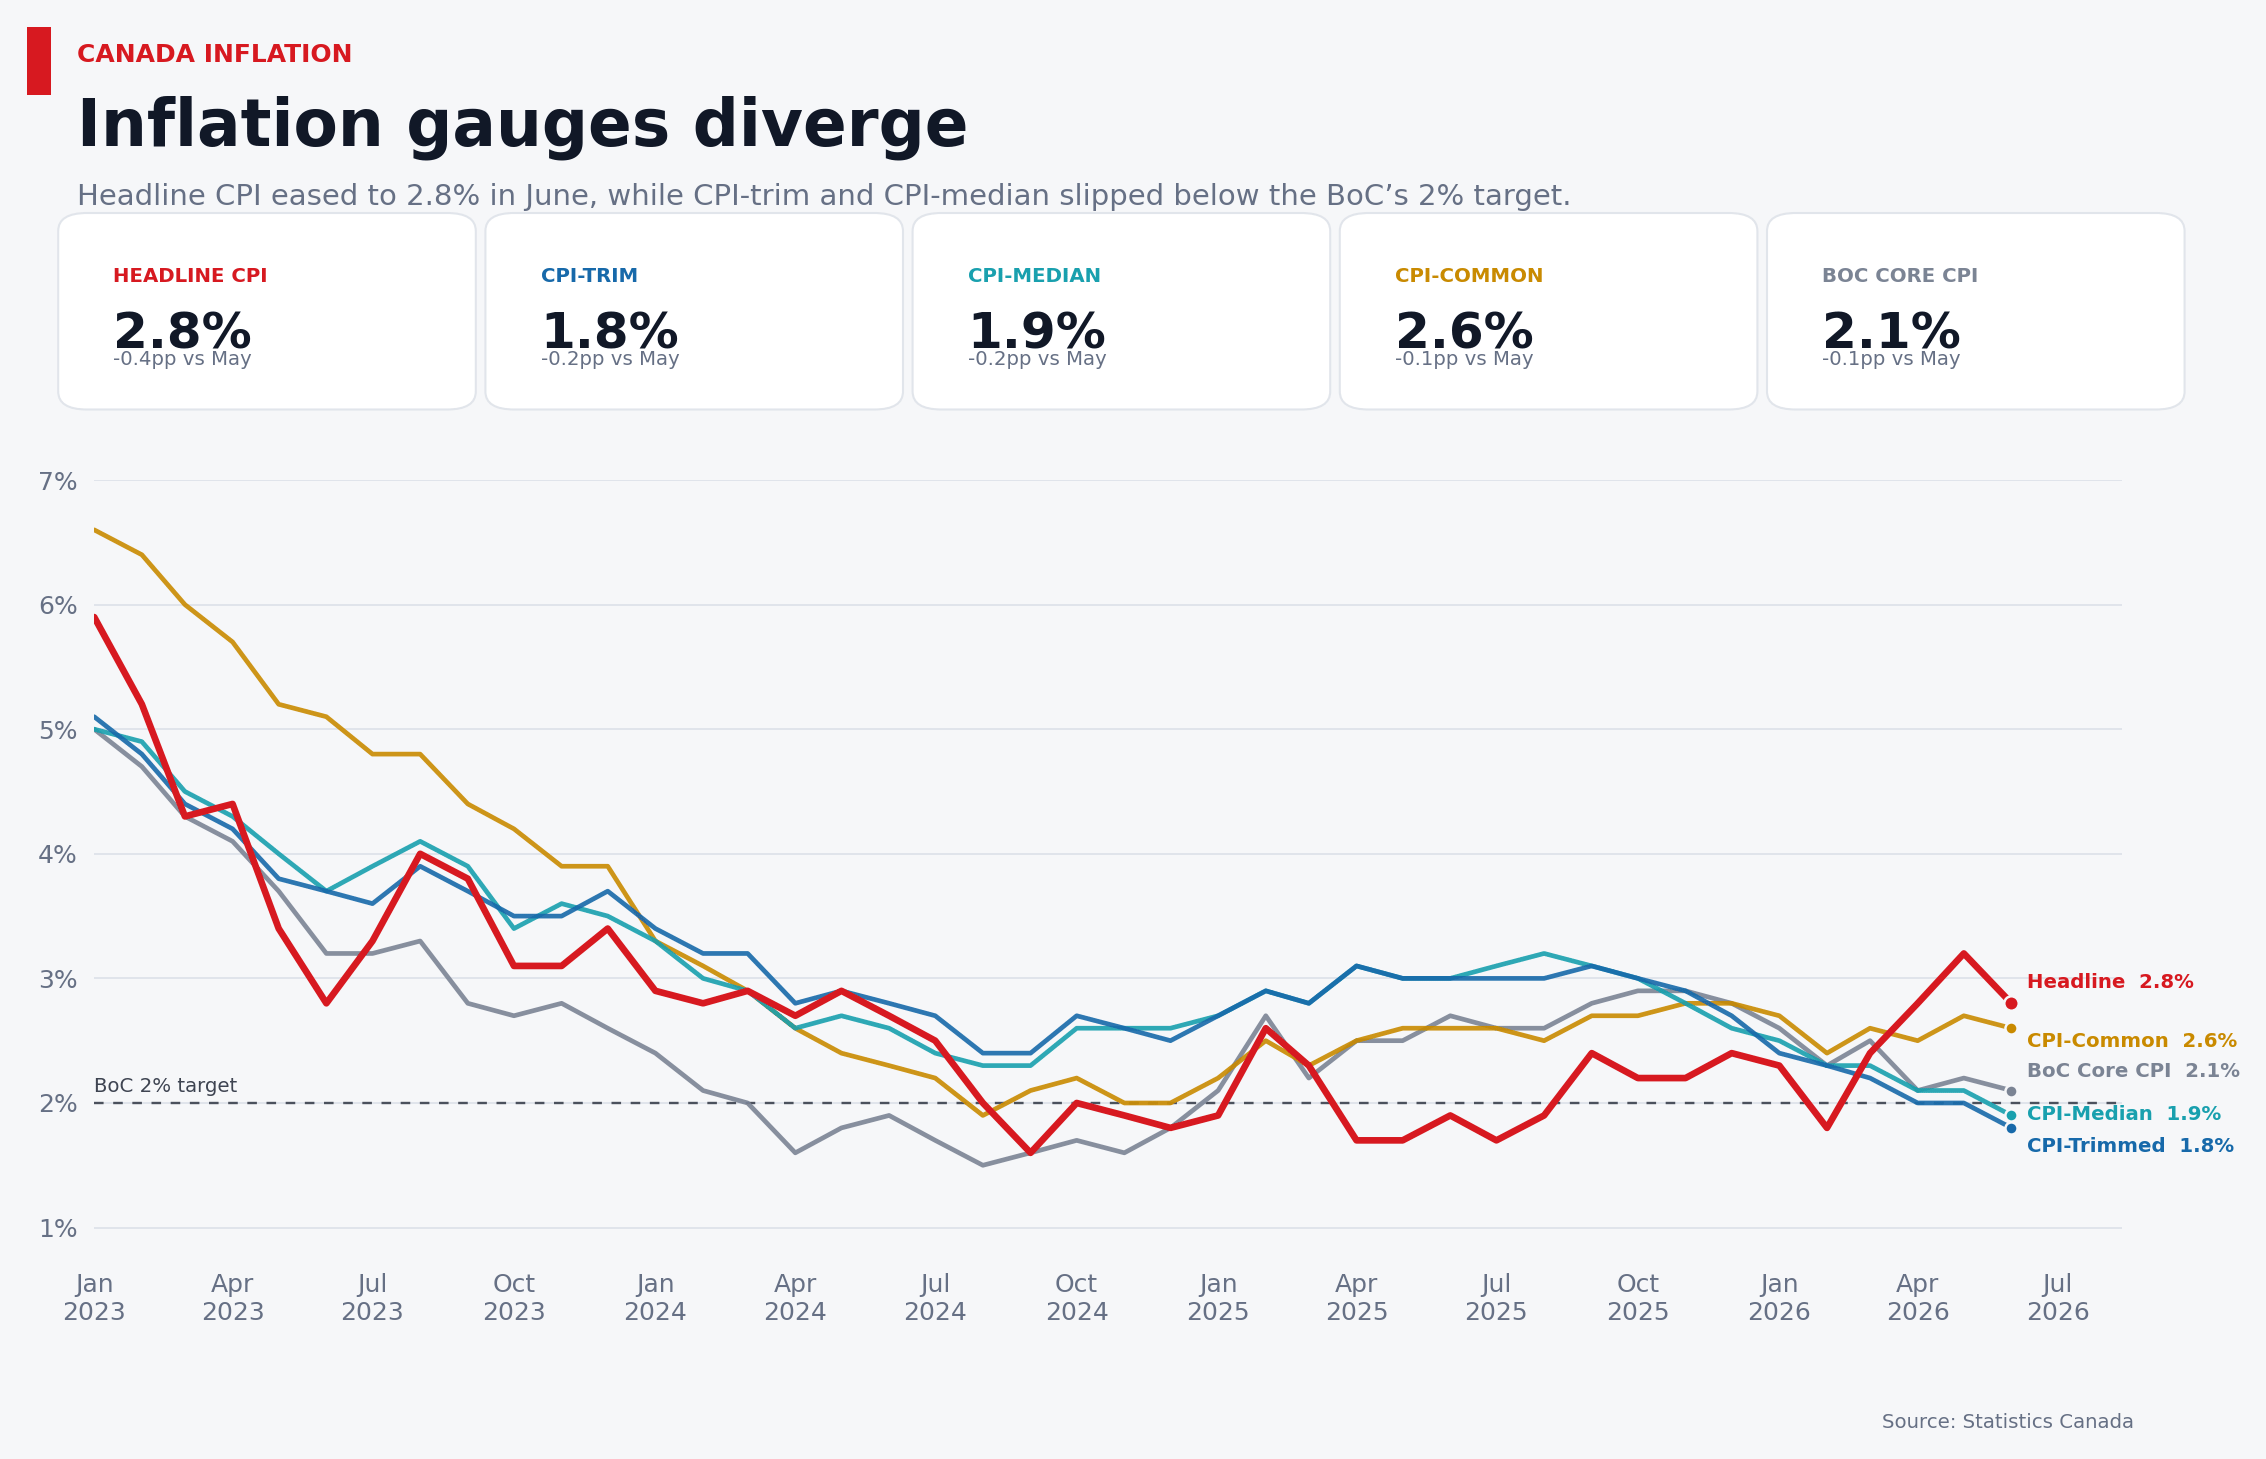
Looking at the BoC’s other key inflation gauges, Common CPI came in at 2.7% (from 2.6%), Trimmed CPI at 1.9% (from 1.8%), and Median CPI at 2% (from 1.9%). Together, they show that the prior impasse in price pressures has now resurfaced.
According to the press release, "On a year-over-year basis, higher prices for gasoline and travel tours in July contributed to the acceleration in the headline CPI. Moderating the faster price growth was a deceleration in the food purchased from stores index. The all-items CPI excluding gasoline rose 2.2% for the third consecutive month.”
Market reaction
The Canadian Dollar (CAD) builds on recent gains and motivates USD/CAD to challenge its key 200-day SMA in the mid-1.3800s. Spot is down for the third consecutive day, revisiting levels last seen in early June.
Canadian Dollar Price Today
The table below shows the percentage change of Canadian Dollar (CAD) against listed major currencies today. Canadian Dollar was the strongest against the US Dollar.
| USD | EUR | GBP | JPY | CAD | AUD | NZD | CHF | |
|---|---|---|---|---|---|---|---|---|
| USD | -0.19% | -0.14% | -0.03% | -0.13% | -0.50% | -0.37% | -0.38% | |
| EUR | 0.19% | 0.02% | 0.15% | 0.04% | -0.30% | -0.20% | -0.19% | |
| GBP | 0.14% | -0.02% | 0.15% | 0.02% | -0.30% | -0.21% | -0.21% | |
| JPY | 0.03% | -0.15% | -0.15% | -0.10% | -0.47% | -0.34% | -0.32% | |
| CAD | 0.13% | -0.04% | -0.02% | 0.10% | -0.36% | -0.25% | -0.24% | |
| AUD | 0.50% | 0.30% | 0.30% | 0.47% | 0.36% | 0.12% | 0.07% | |
| NZD | 0.37% | 0.20% | 0.21% | 0.34% | 0.25% | -0.12% | 0.00% | |
| CHF | 0.38% | 0.19% | 0.21% | 0.32% | 0.24% | -0.07% | -0.00% |
The heat map shows percentage changes of major currencies against each other. The base currency is picked from the left column, while the quote currency is picked from the top row. For example, if you pick the Canadian Dollar from the left column and move along the horizontal line to the US Dollar, the percentage change displayed in the box will represent CAD (base)/USD (quote).
This section below was published as a preview of the Canadian inflation report at 11:00 GMT.
- Canadian inflation is expected to rise by 2.9% YoY in July.
- The core CPI is still seen well above the BoC’s 2% target.
- The Canadian Dollar has been steadily appreciating vs the US Dollar.
Canada’s July Consumer Price Index (CPI) figures will be the focus of attention when published on Monday. Indeed, Statistics Canada data will provide markets with an update on price pressures following the Bank of Canada’s (BoC) July 15 gathering, when officials kept the interest rate steady at 2.25%, broadly in line with the consensus among analysts.
This time, economists expect the headline CPI to rise by 2.9% in the year to July, still above the central bank’s goal and up from June’s 2.8% annual increase. On a monthly basis, prices are expected to rise by 0.7%. The bank will also closely monitor its core measure (which strips food and energy costs), expected to rise by 2.2%, up from the 2.1% YoY gain recorded in the previous month.
In the current context of heightened geopolitical volatility, crude Oil dynamics are likely to keep inflationary pressures anything but abated. Adding to this scenario, we should not forget the impact of US tariffs on domestic consumer prices.
Still around data, the bank’s preferred gauges, CPI-Common, Trimmed Mean, and Median, receded in June to 2.6%, 1.8%, and 1.9%, respectively.
What can we expect from Canada’s inflation rate?
Inflation lost some momentum in June, although market participants remain somewhat sceptical about the continuation of this trend into July.
At its latest gathering, the BoC left its policy rate unchanged at 2.25%. While the reduced annual economic growth projection and current economic slack argue against extra tightening, the combination of higher anticipated inflation and confidence in the recent recovery, plus Governor Tiff Macklem’s specific caution against successive rises, means the BoC is attentive to continued oil-driven price pressures.
So far, market participants expect just over 18 basis points of tightening by year-end.
When is the Canada CPI data due, and how could it affect USD/CAD?
Markets will fully focus on Monday at 12:30 GMT, when Statistics Canada publishes July’s inflation prints. If inflation reverses the recent decline, bets on further rate hikes should likely increase, providing fresh legs for the Canadian Dollar (CAD).
Pablo Piovano, Senior Analyst at FXStreet, notes that USD/CAD has been in a steady downtrend since late July, almost entirely tracking developments in the Middle East conflicts and their impact on the Greenback.
Piovano points out that USD/CAD has recently broken below the 1.3900 support level for the first time since early June. In doing so, it has also left behind its provisional 100-day SMA in the 1.3920 region. Further losses carry the potential to confront the critical 200-day SMA in the mid-1.3800s.
If bulls regain control, the interim 55-day SMA around 1.4060 becomes the immediate target, followed by the August ceiling at 1.4080 (August 4) and the weekly peak at 1.4129 (July 28).
“Momentum could prompt some technical correction,” he adds, noting that the Relative Strength Index (RSI) is entering the oversold threshold near 29, while the Average Directional Index (ADX) around 30 suggests a firm trend.
Bank of Canada FAQs
The Bank of Canada (BoC), based in Ottawa, is the institution that sets interest rates and manages monetary policy for Canada. It does so at eight scheduled meetings a year and ad hoc emergency meetings that are held as required. The BoC primary mandate is to maintain price stability, which means keeping inflation at between 1-3%. Its main tool for achieving this is by raising or lowering interest rates. Relatively high interest rates will usually result in a stronger Canadian Dollar (CAD) and vice versa. Other tools used include quantitative easing and tightening.
In extreme situations, the Bank of Canada can enact a policy tool called Quantitative Easing. QE is the process by which the BoC prints Canadian Dollars for the purpose of buying assets – usually government or corporate bonds – from financial institutions. QE usually results in a weaker CAD. QE is a last resort when simply lowering interest rates is unlikely to achieve the objective of price stability. The Bank of Canada used the measure during the Great Financial Crisis of 2009-11 when credit froze after banks lost faith in each other’s ability to repay debts.
Quantitative tightening (QT) is the reverse of QE. It is undertaken after QE when an economic recovery is underway and inflation starts rising. Whilst in QE the Bank of Canada purchases government and corporate bonds from financial institutions to provide them with liquidity, in QT the BoC stops buying more assets, and stops reinvesting the principal maturing on the bonds it already holds. It is usually positive (or bullish) for the Canadian Dollar.
Economic Indicator
Consumer Price Index (YoY)
The Consumer Price Index (CPI), released by Statistics Canada on a monthly basis, represents changes in prices for Canadian consumers by comparing the cost of a fixed basket of goods and services. The YoY reading compares prices in the reference month to the same month a year earlier. Generally, a high reading is seen as bullish for the Canadian Dollar (CAD), while a low reading is seen as bearish.
Read more.Next release: Mon Aug 17, 2026 12:30
Frequency: Monthly
Consensus: -
Previous: 2.8%
Source: Statistics Canada
Author

FXStreet Team
FXStreet
Composed of a group of economic journalists and FX experts, the FXStreet content team produces and oversees all content published on FXStreet. It provides a purely journalistic approach to the Forex market.
















