BX hits blue box support to resume long term bullish trend

The Blackstone Inc, BX has hit a major support zone amid an all-time bullish cycle from February 2009. Thus, buyers could be looking forward for another big bullish cycle.
Blackstone Inc. (NYSE: BX) is one of the world’s largest alternative asset managers, specializing in private equity, real estate, credit, hedge fund solutions, and infrastructure investments. The company manages hundreds of billions in assets globally and is widely recognized for its influence across financial markets and long-term investment strategies.
BX long term Elliott Wave forecast – Monthly chart
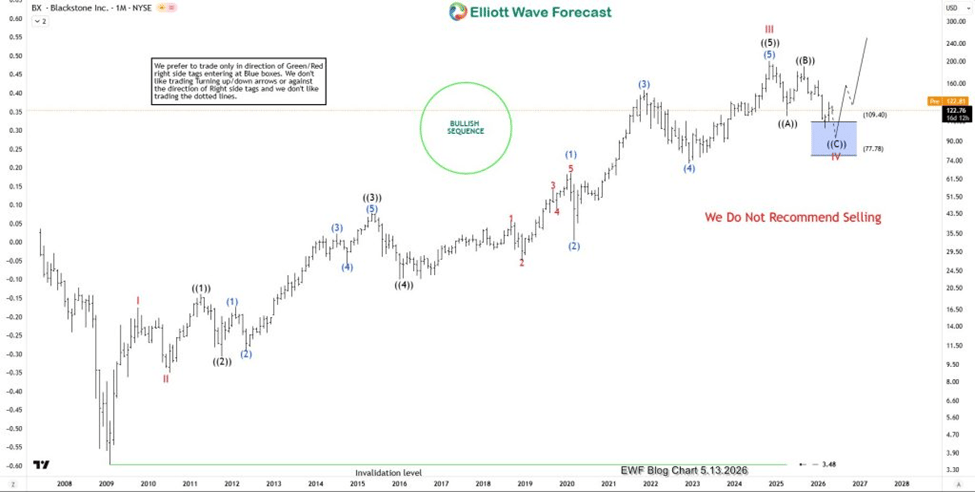
BX, long term, has been very bullish. A strong impulse wave emerged from February 2009. Wave I ended in October 2009 before being corrected in wave II. Wave II closed in July 2010. From the low of July 2010, a big and extended wave III followed all the way to the top of November 2004. Meanwhile, with such an extended 3rd wave, the count allows for differing interpretations. However, the path is very clear. From the top of wave III, the pullback for wave (IV) followed. Wave IV appears to still be emerging. However, it has evolved in a corrective structure and hit a major blue box zone. From this 109.4-77.78 zone, traders can anticipate wave V to begin.
At the end of wave V, the bullish cycle should finish and then BX price should turn lower for a multi-year bearish cycle to correct it. Why do I think the bullish cycle from the year 2009 hasn’t finished yet? Simple. That’s because the current pullback is the 12th swing from the low of February 2009. From the Elliott wave perspective, impulse wave evolves in 5, 9, 13, 17, 21 … sequences. This indicates that at least one more leg should happen higher to complete 13-wave sequence which happens to be the minimum at this stage. If 13-waves fails, then it extends to 17-waves before the price start correcting the cycle from February 2009.
Meanwhile, our attention will be on this pullback – current wave IV. At the blue box, we should expect wave V to evolve to $300 or higher. Alternatively, a 3 or 7 swing corrective bounce could emerge instead, leading to a double and deeper wave IV correction. Which ever of these the market will validate in the coming months, traders and investors can take a long term bullish positions off this zone. Medium term and swing traders can wait for a strong 5-wave reaction on the daily chart and then buy the dip from the extreme of a 3 or 7 swing structure.
Author

Elliott Wave Forecast Team
ElliottWave-Forecast.com
















