|
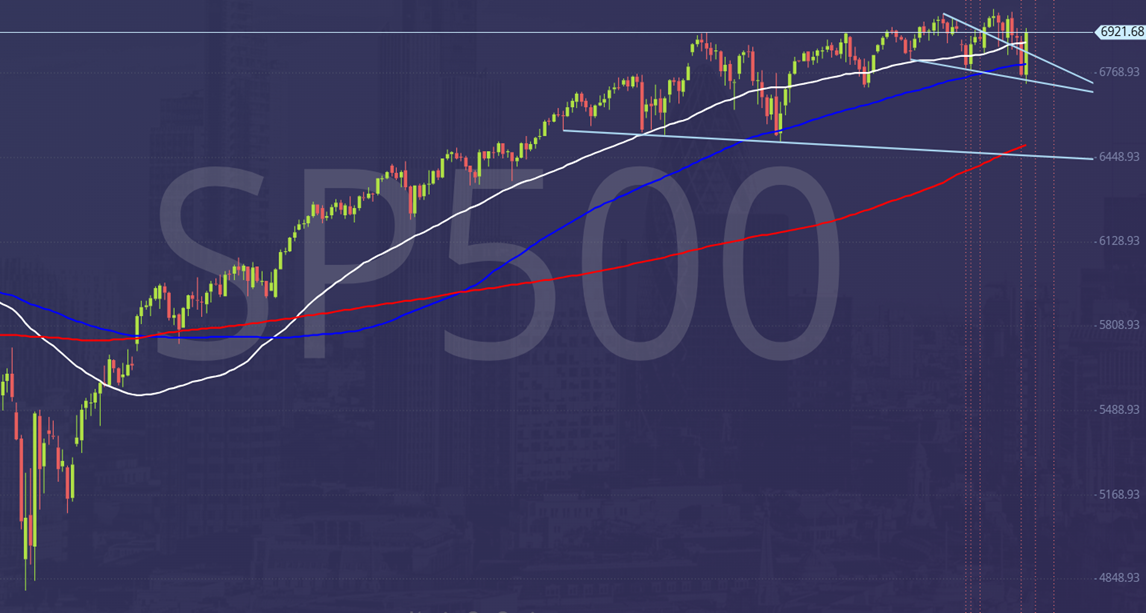
Bullish engulfing candles on the daily chart for stock markets

Emini S&P futures
- Emini S&P March futures broke towards strong support at 6740/6730 but we made a low for the week 11 points above here so it was frustrating that we didn't get this buying opportunity.
- A huge rally hit targets of 6810/20 & minor resistance at 6850/6860. Then the break higher hit my next targets of 6890 & 6915/25.
- In a huge move we rallied over 200 points from Thursday's low to hit 6965.
- I stuck with my strategy of buying into support levels
- Unfortunately we didn't quite reach my buy level. I hope 1 way or another you managed to capitalise on the expected move higher.
- Of course bulls remain in full control of this market despite the negative 'AI bubble' narrative, which I simply do not believe.
- We now have a bullish engulfing candle from Friday's price action which gives me further reason to believe that eventually we will break to new highs.
- Until we do actually break above 7043, and see a daily close above here, we remain in a sideways consolidation.
- I still think the downside will be limited and today we should have minor support at 6920/6910 then good support 6860/6850, should we fall this far.
Nasdaq futures
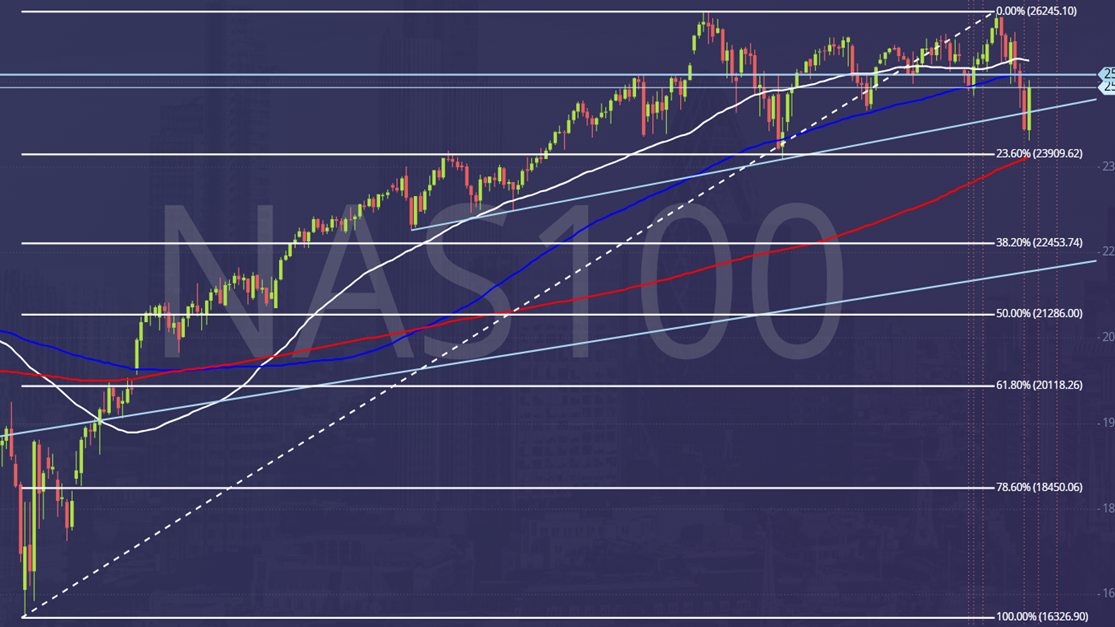
- Emini Nasdaq March futures broke lower to very strong support at 24200/24000.
- We wrote: A low for the day correction is possible here but longs need stops below 23850.
- Unfortunately we didn't quite get to buy exactly at my buy level, with a low for the correction just 40 points above at 24239
- If you did manage to jump into a long position at some stage on Friday we hit all my targets as far as 24900/25000.
- On Friday we wrote: Just be aware that a weekly close above 25170 would be very positive for the start of next week.
- Although we closed 25163, I still take this as a positive start for this week especially as we formed a bullish engulfing candle.
- However, we do have to overcome some minor barriers such as the 2 month trend line & 100 hour MA resistance around 25230/25250, then the 100 day moving average at 25330.
- Therefore I'm going to take a break above 25390 as a clear buy signal initially targeting 25550/25650.
- Once we get through 25650 we could move quite quickly to 25950/26000.
- First support at 25990/25900 & longs need stops below 25800.
- As long as we hold above here the bulls remain in control but a move back below 25800 comes with the risk that we remain in a sideways consolidation.
Emini Dow Jones futures
- Emini Dow Jones March leading the way forward as we beat the upper end of the recent range at 49795 and break to a new all time high above 50000.
- The close at the high of the day and the high of the week should trigger further gains this week with my first target at 50500/50600.
- we should now have strong support at 49900/49800 & longs need stops below 49650.
- A break below 49650 could bring us back into sideways consolidation trading so I certainly hope this does not happen!!
Author

Jason Sen
DayTradeIdeas.co.uk
Jason Sen began his career in the options pits on the trading floor of LIFFE in 1987 at the age of 19, making markets on his own account. In 2001 when the trading floor closed he successfully made the transition to day trading on computer screens.
More from Jason Sen