Broad-based growth meets bank caution: The evolving Q3 earnings picture

Here are the key points
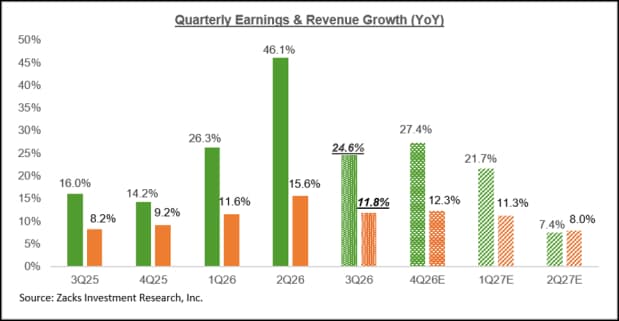
- Total Q3 earnings for the 32 S&P 500 members that have reported results already are up +52.5% from the same period last year on +15.8% higher revenues, with 81.3% beating EPS estimates and 71.9% beating revenue estimates.
- The EPS and revenue beats percentages at this admittedly early stage in the Q3 reporting cycle are tracking modestly below what we had seen from this same group of companies in other recent periods. The reported earnings and revenue growth rates have been boosted by outsized gains at Micron, with the Q3 growth comparisons tracking modestly unfavorably with other recent periods when the Micron numbers are excluded.
- The relatively underwhelming start to the Q3 reporting cycle notwithstanding, the overall setup remains favorable, with earnings growth expected to be in the double digits for the 8th consecutive quarter. The growth momentum is broad-based, with 14 of the 16 Zacks sectors expected to enjoy positive earnings growth and the outlook steadily improving.
- Excluding the Tech sector’s substantial contribution, Q3 earnings for the rest of the S&P 500 index would be up +14.6% (vs. +24.6% otherwise). Excluding the Energy sector, the aggregate growth rate would decline to +20.3%.
What’s weighing on bank stocks after strong Q3 results?
Despite headline earnings misses by JPMorgan and Bank of America, Q3 results from these banks and their peers have been very strong, with robust equity trading volumes and accelerating investment banking activities, particularly in equity underwriting and M&A.
Net interest income was up at each of the money-center banks – JPMorgan (JPM), Citigroup (C), Bank of America (BAC) and Wells Fargo – with NII at JPMorgan up +6% (excluding markets) relative to the same period last year, up +7% at Citigroup, +8% at Bank of America and +5% at Wells Fargo. Other than JPMorgan, whose Q3 NII was modestly down sequentially, the other three banks enjoyed gains relative to the preceding period.
On the trading side, the gains were entirely from the equities markets, while revenues from the fixed income, currencies, and commodities (FICC) business were down across all the banks. Citigroup was the sole exception on the FICC side, with the bank enjoying its best Q3 trading performance in many years.
These results failed to change the banks’ negative stock market momentum ahead of these results. You can see this in the performance chart below that shows the performance of JPMorgan, Wells Fargo, Bank of America, and Citigroup shares relative to the S&P 500 index since the end of June.
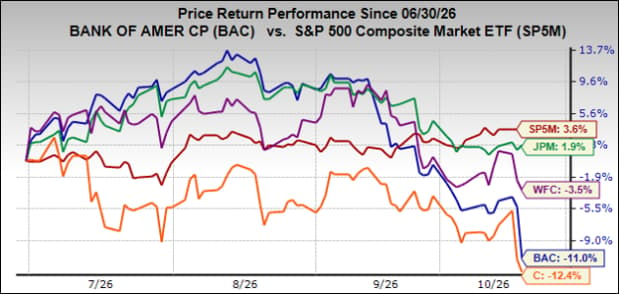
Market participants are likely weighing future headwinds rather than backward-looking Q3 results in pushing these stocks lower. At the core of their concerns is interest rate volatility, which obscures NII visibility, alongside a potential deceleration in trading revenue from recent cyclical highs. Because NII and capital markets activity drove outsized bank profits over the last four quarters, a plateau in these activities is likely fueling investor caution.
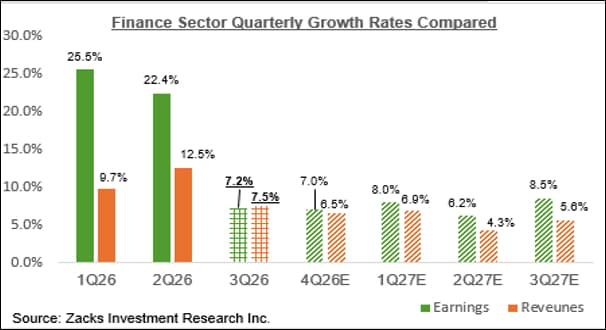
For the Finance sector’s Q3 scorecard, we now have results from 33% of the sector’s market capitalization in the S&P 500 index. Total earnings for these banks are up +10% from the same period last year on +12.7% higher revenues, with 77.8% beating EPS estimates and 66.7% beating revenue estimates.
For Q3 as a whole, combining actual results with estimates for the remaining stocks, total Finance sector earnings are expected to increase +7.2% from the same period last year, on +7.5% higher revenues.
The earnings big picture
The chart below shows S&P 500 expectations for 2026 Q3, comparing what was achieved in the preceding four periods with what is currently expected for the following three quarters.
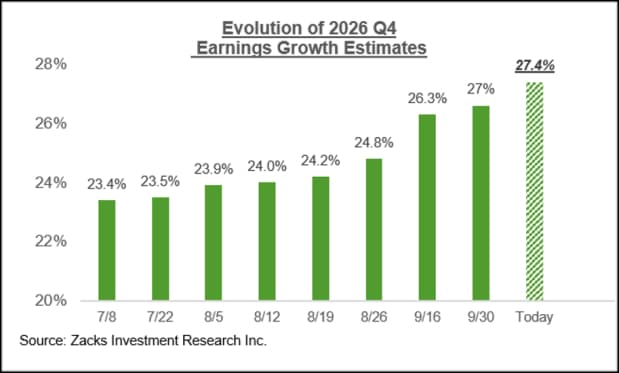
We have been showing here how Q3 estimates moved higher since the quarter got underway. Below, we show how estimates for the last quarter of the year have evolved in recent weeks.
The chart below shows the overall earnings picture for the S&P 500 index on an annual basis.
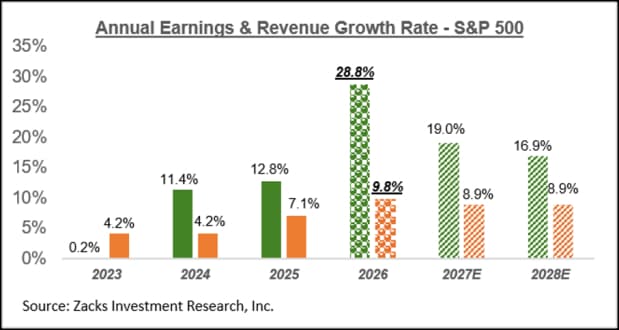
As is the case with estimates for 2026 Q4, estimates for full-year 2027 are also moving higher, as the chart below shows.
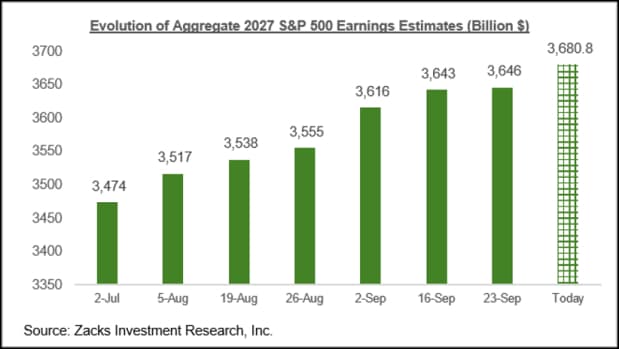
Since the beginning of July, estimates for 2027 have increased for 10 of the 16 Zacks sectors, with Tech, Energy, Finance and Industrials leading the way.
We will see how this revisions trend evolves as companies report Q3 results and share updates on developments in their businesses.
Want the latest recommendations from Zacks Investment Research? Download 7 Best Stocks for the Next 30 Days. Click to get this free report
Author

Zacks
Zacks Investment Research
Zacks Investment Research provides unbiased investment research and tools to help individuals and institutional investors make confident investing decisions.