British Pound falls as Oil shock boosts the US Dollar
- US-Iran hostilities lift Oil, boosting Dollar and Treasury yields.
- June CPI data could reset Fed tightening expectations.
- Burnham cabinet uncertainty keeps Sterling exposed to fiscal-risk premium.

The Pound Sterling begins the week on a lower note, as over-the-weekend developments in the Middle East fueled inflation expectations due to the rise in Oil prices. At the time of writing, the GBP/USD trades at 1.3369, down over 0.20%.
GBP/USD slips as Middle East attacks revive inflationary expectations
The constant exchange of attacks between the US and Iran triggered a flight to safe-haven assets, bolstering the Greenback. The US Dollar Index (DXY), which tracks the buck against a basket of six currencies, is up 0.18% at 101.14.
In addition, US Treasury yields are rising as high energy prices are increasing the likelihood of higher US interest rates. Traders had fully priced in a 33-basis-point increase toward the end of the year, according to Prime Terminal data.
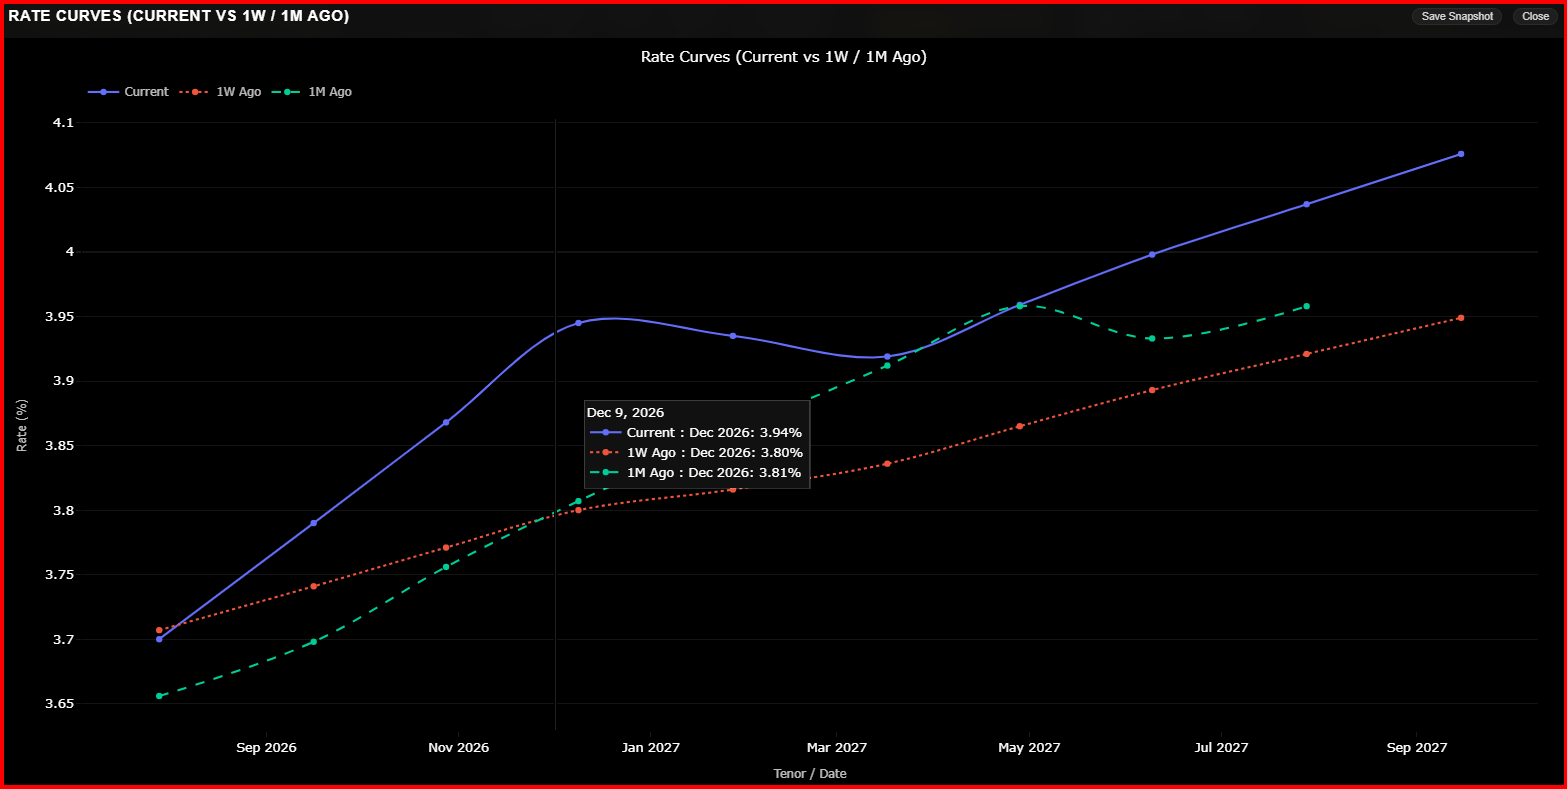
Meanwhile, the US economic docket is absent on Monday, as traders await the release of the Consumer Price Index (CPI) data for June on Tuesday. Economists estimate that headline CPI will dip -0.1% MoM, down from a 0.5% increase, while core CPI is projected to remain unchanged at 0.2% MoM.
In the UK, the docket was absent, though last week the Bank of England (BoE) Chief Economist Huw Pill said that interest rates need to rise in the year ahead. Money markets had priced in 33 basis points of BoE tightening by the end of 2026.
In the meantime, uncertainty about the cabinet of the incoming Prime Minister, Andy Burnham, could be a headwind for Sterling. Although he and his team pledged to current Chancellor Rachel Reeves' fiscal rules, a sudden shift could send UK Gilts soaring if the markets demand a higher risk premium in the case that fiscal spending grows.
GBP/USD price forecast: technical outlook
In the daily chart, GBP/USD trades at 1.3379, retaining a capped tone as it holds below the latest Simple Moving Average (SMA) from the triple set at 1.3391 while remaining under the broader downward resistance trendline anchored by a break level near 1.3498. The mildly positive Relative Strength Index (RSI) around 54 hints that downside pressure is not aggressive, yet the pair still trades beneath these key reference levels, suggesting rallies are vulnerable while those resistances remain intact.
On the topside, immediate resistance is seen at the SMA from the triple cluster around 1.3391, with the downward resistance trendline’s break area near 1.3498 acting as a stronger cap if buyers extend a bounce. On the downside, structural support is derived from the broader upward support trendline rooted near 1.3159, where a break would expose a deeper bearish extension. Holding above this floor would keep the pair in a wider consolidative phase despite the current overhead barriers.
(The technical analysis of this story was written with the help of an AI tool. Know more.)
Pound Sterling Price Today
The table below shows the percentage change of British Pound (GBP) against listed major currencies today. British Pound was the strongest against the Swiss Franc.
| USD | EUR | GBP | JPY | CAD | AUD | NZD | CHF | |
|---|---|---|---|---|---|---|---|---|
| USD | 0.16% | 0.19% | 0.41% | -0.08% | 0.30% | -0.13% | 0.45% | |
| EUR | -0.16% | 0.04% | 0.26% | -0.24% | 0.15% | -0.24% | 0.31% | |
| GBP | -0.19% | -0.04% | 0.22% | -0.28% | 0.12% | -0.27% | 0.31% | |
| JPY | -0.41% | -0.26% | -0.22% | -0.49% | -0.11% | -0.49% | 0.10% | |
| CAD | 0.08% | 0.24% | 0.28% | 0.49% | 0.40% | 0.03% | 0.60% | |
| AUD | -0.30% | -0.15% | -0.12% | 0.11% | -0.40% | -0.35% | 0.23% | |
| NZD | 0.13% | 0.24% | 0.27% | 0.49% | -0.03% | 0.35% | 0.59% | |
| CHF | -0.45% | -0.31% | -0.31% | -0.10% | -0.60% | -0.23% | -0.59% |
The heat map shows percentage changes of major currencies against each other. The base currency is picked from the left column, while the quote currency is picked from the top row. For example, if you pick the British Pound from the left column and move along the horizontal line to the US Dollar, the percentage change displayed in the box will represent GBP (base)/USD (quote).
Author

Christian Borjon Valencia
FXStreet
Markets analyst, news editor, and trading instructor with over 14 years of experience across FX, commodities, US equity indices, and global macro markets.

















