NZD/USD Price Forecast: Kiwi holds below 200-day as bears target 0.5700
- NZD/USD remains below 200-day SMA for 25 sessions.
- RSI shows buyers active, but consolidation risk remains elevated.
- Break below 0.5700 exposes 0.5672 and 0.5650 supports.

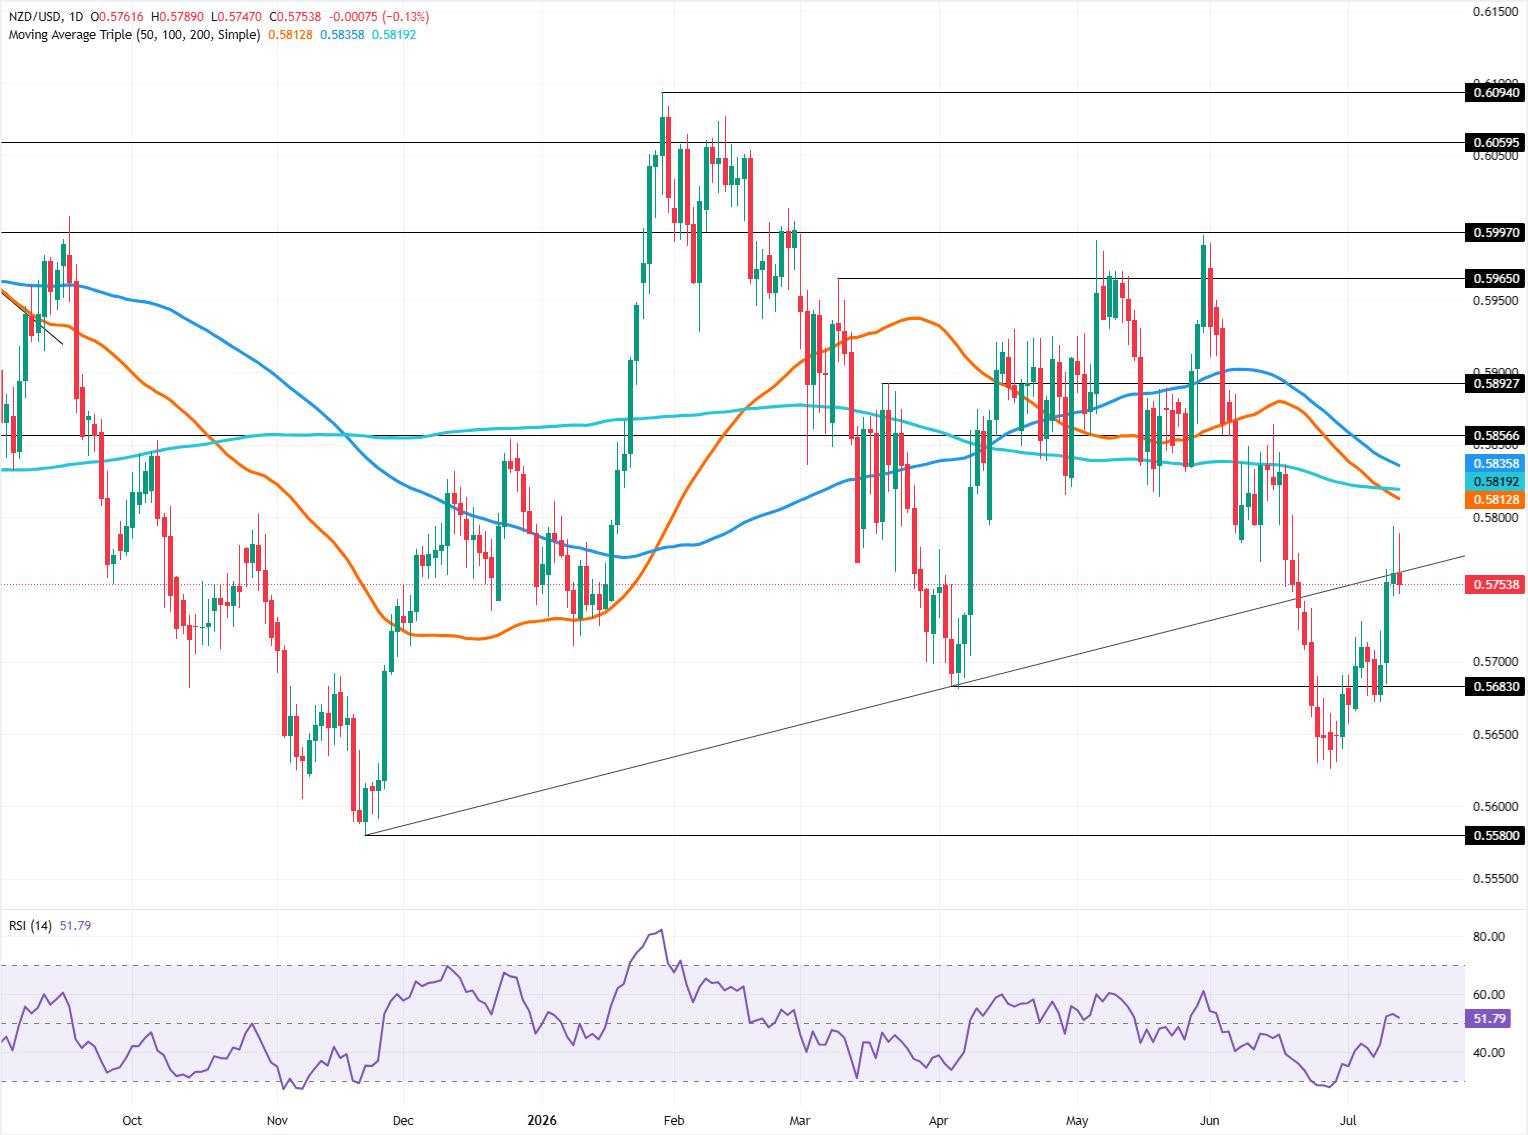
The New Zealand Dollar recoiled during Monday’s North American session, down 0.12%, as the Greenback posted gains versus most G8 FX currencies amid rising geopolitical tensions and hawkish comments from a Fed Governor. The NZD/USD trades at 0.5754, down from daily highs of 0.5789.
NZD/USD price forecast: Technical outlook
The Kiwi Dollar remains downwardly biased, with the pair standing below the 200-day Simple Moving Average (SMA) at 0.5819 for the 25th consecutive trading day. This is despite the Reserve Bank of New Zealand (RBNZ) raising rates and opening the door to further tightening.
Momentum, as measured by the Relative Strength Index (RSI), suggests that buyers are in charge. Though as of writing, it signals further consolidation ahead.
For a bearish continuation, the NZD/USD must drop below the psychological 0.5700 figure. Below this area lies the July 8 low of 0.5672, followed by 0.5650. Once hurdled, the next stop is the 0.5600 milestone.
Upwards, the first resistance is the July 10 daily high at 0.5794, ahead of 0.5800. Above this level lies the confluence of the 50-day and 200-day SMAs at around 0.5812-0.5819, respectively, followed by the 100-day SMA at 0.5835 and by the 0.5850 mark.
New Zealand Dollar Price Today
The table below shows the percentage change of New Zealand Dollar (NZD) against listed major currencies today. New Zealand Dollar was the strongest against the Swiss Franc.
| USD | EUR | GBP | JPY | CAD | AUD | NZD | CHF | |
|---|---|---|---|---|---|---|---|---|
| USD | 0.25% | 0.33% | 0.42% | -0.00% | 0.47% | 0.13% | 0.66% | |
| EUR | -0.25% | 0.08% | 0.17% | -0.26% | 0.25% | -0.09% | 0.42% | |
| GBP | -0.33% | -0.08% | 0.09% | -0.34% | 0.17% | -0.15% | 0.38% | |
| JPY | -0.42% | -0.17% | -0.09% | -0.43% | 0.05% | -0.25% | 0.28% | |
| CAD | 0.00% | 0.26% | 0.34% | 0.43% | 0.50% | 0.21% | 0.73% | |
| AUD | -0.47% | -0.25% | -0.17% | -0.05% | -0.50% | -0.28% | 0.25% | |
| NZD | -0.13% | 0.09% | 0.15% | 0.25% | -0.21% | 0.28% | 0.53% | |
| CHF | -0.66% | -0.42% | -0.38% | -0.28% | -0.73% | -0.25% | -0.53% |
The heat map shows percentage changes of major currencies against each other. The base currency is picked from the left column, while the quote currency is picked from the top row. For example, if you pick the New Zealand Dollar from the left column and move along the horizontal line to the US Dollar, the percentage change displayed in the box will represent NZD (base)/USD (quote).
Author

Christian Borjon Valencia
FXStreet
Markets analyst, news editor, and trading instructor with over 14 years of experience across FX, commodities, US equity indices, and global macro markets.