Bearish pressure builds on S&P 500 amid ongoing wave setup [Video]
![Bearish pressure builds on S&P 500 amid ongoing wave setup [Video]](https://editorial.fxsstatic.com/images/i/Equity-Index_S&P500-1.jpg)
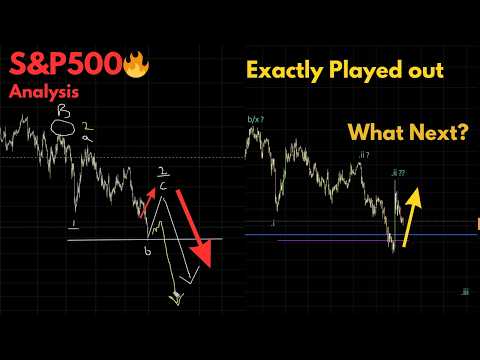
The S&P 500 continues to trade within a broader bearish Elliott Wave framework, with price action unfolding in a manner consistent with a structured corrective-to-impulsive transition. Recent market behaviour suggests that the larger wave count remains valid, keeping the focus on potential continuation to the downside as the next phase of the structure develops.
Higher Time Frame Perspective
From a higher time frame standpoint, the index appears to be progressing along a projected bearish pathway, with the broader wave sequence still incomplete. The overall structure indicates that the market may have further downside legs to unfold before the corrective cycle reaches maturity.
This perspective provides the strategic backdrop for traders, helping define directional bias and risk positioning within the evolving market environment.
Lower Time Frame Structure and Market Positioning
A closer examination of the lower time frame price action reveals the internal wave development currently shaping near-term expectations. Monitoring these sub-waves is essential for understanding both the timing and momentum characteristics of the next directional move.
At present, two structurally consistent scenarios remain in focus:
A deeper corrective pullback, allowing the market to rebalance before resuming its downward trajectory
A shallow or sideways consolidation, followed by a more immediate continuation to the downside
While both pathways align with the prevailing bearish outlook, the lower time frame structure is likely to provide the confirmation signals that determine which scenario materialises.
Importance of Structural Confirmation
This phase represents a technically sensitive zone where wave confirmation and price behaviour play a crucial role. Traders observing the S&P 500 may benefit from tracking how the internal structure evolves, as this can offer insight into the strength and sustainability of the next bearish leg.
The accompanying video provides a detailed visual breakdown of the higher and lower time frame wave counts, outlining the key structural markers to watch in the sessions ahead.
Author

Neerav Yadav
50 Eyes Market Analysis
Neerav Yadav is a Futures trader who is in the markets since 2014 and trades primarily in Energy Futures, Gold, Indices, Stocks and other instruments.
















