|

AUD/USD Price Analysis: Bears take a breather ahead of key PCE data

  • The AUD/USD trades at 0.6580, securing mild gains above the 200-day SMA.
  • Signs of selling momentum are still visible on the daily charts.
  • Despite bearish trends reflected last week, overall bulls lead as pair trades above the 100 and 200-day SMAs.

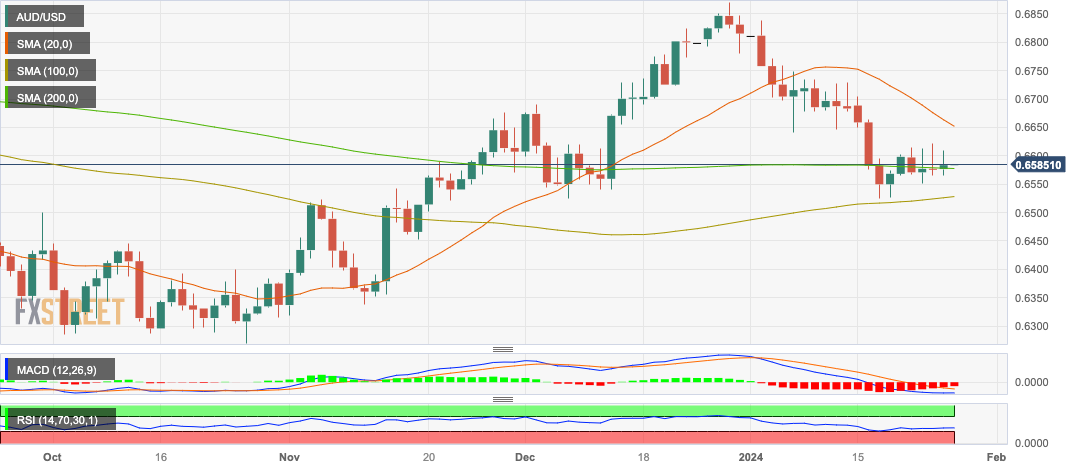
In Thursday's session, the AUD/USD was seen trading at 0.6580 with mild gains, rebounding slightly after last week's 1.20% loss. A neutral to bullish daily outlook is observed, with bears currently taking a breather. This, combined with a brighter outlook on the four-hour chart, suggests the pair might experience more bullish traction in the short term.

On the fundamental side, the AUD/USD has recently been pushed down by the strong US economic performance which makes markets think that the Federal Reserve (Fed) won’t rush to validate the market's easing expectations with a rate cut. On the other hand, Australia confirmed plans to scale back tax relief for the wealthy, effectively lifting pressure on the Reserve Bank of Australia (RBA) to continue restrictive monetary policy. Market expectations predict the RBA's first rate cut in September while markets pushed the start of the easing cycle of the Fed to May from March.

On Friday, the US will release December’s Personal Consumption Expenditures (PCE) figures which may likely set the tone of the pair for the short term.

AUD/USD levels to watch

From the daily chart indicators, the trading scene appears to be heavily influenced by the bears. Despite this, the bulls maintain their presence, preventing any significant downturn. The negative slope and the unfavorable positioning of the Relative Strength Index (RSI) within the negative area send off bearish signals. Meanwhile, the flat red bars of the Moving Average Convergence Divergence (MACD) further suggest a continued selling momentum. Yet the underlying strength of the pair becomes apparent as it comfortably aligns above the 100 and 200-day Simple Moving Averages (SMAs), even though it sits below the 20-day SMA. After the previous week's 1.20% drop, the current bearish action feels perhaps more like a pause in the action rather than a complete shift in sentiment.

Turning towards the shorter-term outlook, the prospects appear more promising on the four-hour chart. With the four-hour Relative Strength Index (RSI) indicating a positive slope in the negative territory, it suggests a mounting buying pressure that may soon translate into a bullish momentum. The flat red bars of the four-hour Moving Average Convergence Divergence (MACD) remain, suggesting a mostly flat short-term trend. However, their decline in intensity points towards a potential ease off selling pressure.

AUD/USD

Overview
Today last price0.6584
Today Daily Change0.0007
Today Daily Change %0.11
Today daily open0.6577
 
Trends
Daily SMA200.6676
Daily SMA500.6656
Daily SMA1000.6524
Daily SMA2000.6579
 
Levels
Previous Daily High0.6621
Previous Daily Low0.6566
Previous Weekly High0.6705
Previous Weekly Low0.6525
Previous Monthly High0.6871
Previous Monthly Low0.6526
Daily Fibonacci 38.2%0.6587
Daily Fibonacci 61.8%0.66
Daily Pivot Point S10.6555
Daily Pivot Point S20.6533
Daily Pivot Point S30.65
Daily Pivot Point R10.661
Daily Pivot Point R20.6643
Daily Pivot Point R30.6665

AUD/USD daily chart

Author

Patricio Martín

Patricio is an economist from Argentina passionate about global finance and understanding the daily movements of the markets.


More from Patricio Martín
Share:

Editor's Picks

AUD/USD remains confined in a range above 0.7100

AUD/USD extends its consolidative price move above 0.7100 through the Asian session on Tuesday, shrugging off hawkish comments from RBA Assistant Governor Sarah Hunter as traders keenly await the crucial Trump-Xi summit later this week. Meanwhile, escalating tensions in the Middle East and the Fed's hawkish outlook remain supportive of the bullish US Dollar undertone, capping spot prices.

USD/JPY bulls seem cautious below 157.50 as JPY intervention risks loom

USD/JPY consolidates below mid-157.00s during the Asian session on Tuesday as intervention fears help limit losses for the Japanese Yen. However, the BoJ's dovish rate hike to a 31-year high keeps JPY bulls on the back foot. At the same time, the US Dollar retains its bullish undertone amid the Fed's hawkish outlook and escalating Middle East tensions, acting as a tailwind for the pair.

Gold benefits from falling US bond yields; remains below $4,400 amid bullish USD

Gold regains positive traction during the Asian session on Tuesday, though it lacks bullish conviction and remains below $4,400. Falling oil prices ease inflation fears, dragging US bond yields lower and supporting the non-yielding yellow metal. Meanwhile, the Fed's hawkish stance, along with escalating Middle East tensions, keeps the US Dollar near its highest level since late July and acts as a headwind for the bullion.

Ethereum rallies above $2,700 as investors shrug off bearish sentiment
Ethereum (ETH) climbed above $2,700 on Monday after investors defended the realized price level despite negative sentiment over the Clarity Act's failure and the Federal Reserve rate hike. After the Clarity Act failed to advance in the Senate, ETH dipped below $2,400 last week. But right below that price is the top altcoin's realized price, or average on-chain cost basis, at $2,310.
The week ahead: Fuel prices in focus as we lead up to key eco releases

Financial markets are in a strange position as we move to the final weeks of Q3, uncertainty and volatility continue to grip markets, but the oil price is falling; and European and US stocks are poised to open higher later on Monday. Market stresses are concentrated in sovereign bonds, and European and US yields had another scare late on Friday, and moved higher.

BoJ Recap: Not as hawkish as expected

The Bank of Japan (BoJ) raised its short-term interest-rate target to 1.25% from 1.00% in a 7-2 vote, marking another step in the normalisation of monetary policy and widely matching what everyone has been expecting for weeks.