AUD/JPY Price Forecast: Forms shooting-star, drops below 112.00 as bears lurk
- AUD/JPY rises as ceasefire optimism boosts global risk appetite.
- RSI tilts lower despite bullish bias, signaling fading upside momentum.
- Break below 111.50 exposes 111.00 and 110.47 support levels.

The Australian Dollar extended its gains versus the Japanese Yen, driven by an improvement in risk appetite amid the two-week pause in the Middle East conflict between the US and Iran. Still, traders must be aware that hostilities remain as Israel strikes Beirut, saying that Lebanon is not part of the deal. At the time of writing, the AUD/JPY trades at 111.79, up 0.39%.
AUD/JPY Price Forecast: Technical Outlook
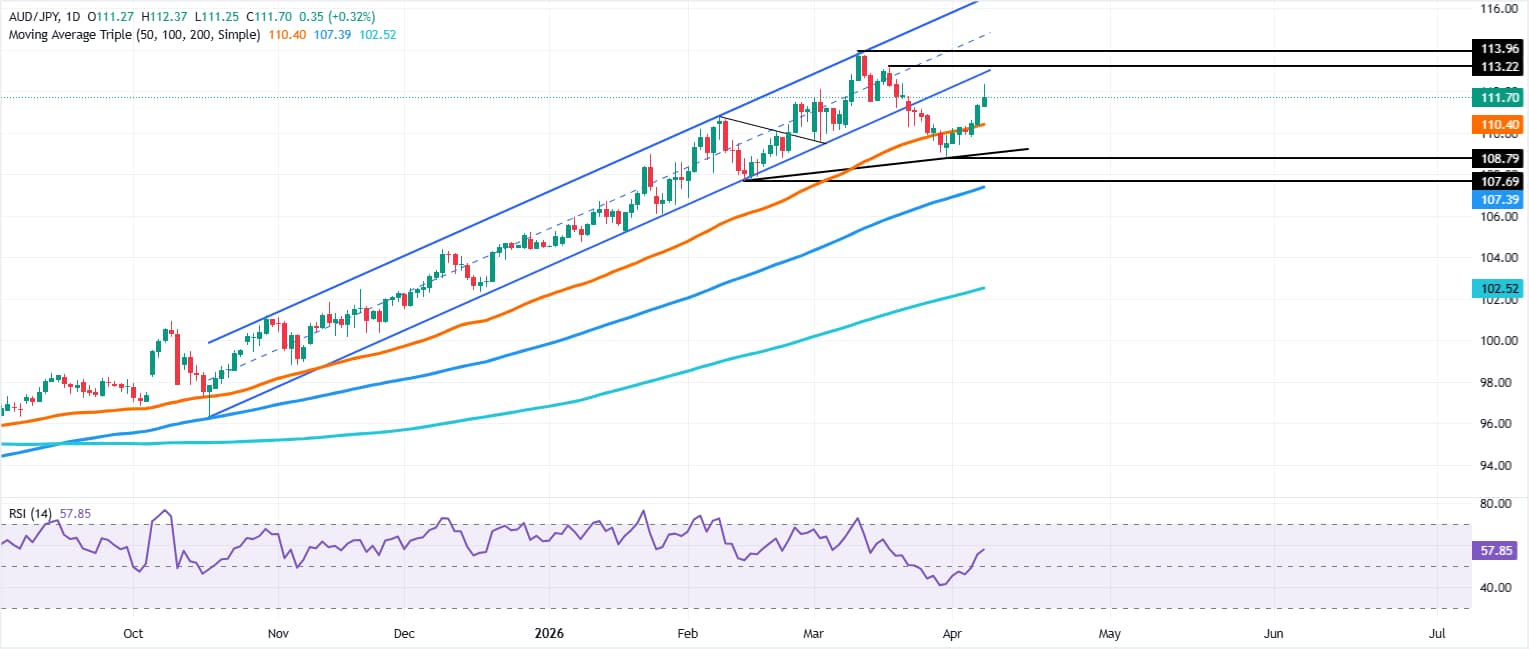
From a technical perspective, the AUD/JPY seems poised to consolidate, as it forms a quasi-shooting star, preceded by an uptrend that is about to close below the candle's half-size, an indication that buyers are losing momentum.
This is reflected in the Relative Strength Index (RSI), which is bullish, but tilted to the downside, towards the index`s 50-neutral level. Hence, a clear break below 50 would mean that sellers are gaining momentum, pushing the AUD/JPY lower.
For a bullish continuation, buyers need to clear the April 8 daily high at 112.38, which would open the path to challenge 113.00. Further resistance lies overjed at 113.96, the March 11 peak.
Conversely, if AUD/JPY drops to 111.50, a psychological level a move towards the 20-day Simple Moving Average (SMA) at 111.02 and the 111.00 figure is likely. Below here, sellers are gradually taking hold, driving the cross towards the 50-day SMA at 110.47, ahead of the 110.00 milestone.
AUD/JPY Price — Chart
Australian Dollar Price This week
The table below shows the percentage change of Australian Dollar (AUD) against listed major currencies this week. Australian Dollar was the strongest against the US Dollar.
| USD | EUR | GBP | JPY | CAD | AUD | NZD | CHF | |
|---|---|---|---|---|---|---|---|---|
| USD | -1.21% | -1.55% | -0.63% | -0.68% | -2.20% | -2.21% | -1.12% | |
| EUR | 1.21% | -0.35% | 0.57% | 0.56% | -1.02% | -1.02% | 0.08% | |
| GBP | 1.55% | 0.35% | 0.87% | 0.88% | -0.66% | -0.68% | 0.43% | |
| JPY | 0.63% | -0.57% | -0.87% | -0.05% | -1.55% | -1.55% | -0.53% | |
| CAD | 0.68% | -0.56% | -0.88% | 0.05% | -1.54% | -1.52% | -0.44% | |
| AUD | 2.20% | 1.02% | 0.66% | 1.55% | 1.54% | -0.02% | 1.11% | |
| NZD | 2.21% | 1.02% | 0.68% | 1.55% | 1.52% | 0.02% | 1.12% | |
| CHF | 1.12% | -0.08% | -0.43% | 0.53% | 0.44% | -1.11% | -1.12% |
The heat map shows percentage changes of major currencies against each other. The base currency is picked from the left column, while the quote currency is picked from the top row. For example, if you pick the Australian Dollar from the left column and move along the horizontal line to the US Dollar, the percentage change displayed in the box will represent AUD (base)/USD (quote).
Author

Christian Borjon Valencia
FXStreet
Markets analyst, news editor, and trading instructor with over 14 years of experience across FX, commodities, US equity indices, and global macro markets.

















