AT&T (T) Stock Earnings News: Revenue miss sends shares down 5%, EPS drops 22%
- AT&T missed revenue projections by $80 million in Q1.
- T stock lost more than 5% in Thursday's premarket.
- Adjusted EPS fell 22% YoY.
- CEO Stankey praised the company's 5G efforts.

AT&T (T) stock has lost 5.1% in Thursday's premarket, falling to $18.70, after missing Wall Street's revenue target for the first quarter. Revenue of $30.14 billion rose just 1.4% YoY and was $80 million lower than Wall Street analyst consensus.
The market is selling off on Thursday as well with Tesla's (TSLA) margin compression in their results late Wednesday leading to broad market disgruntlement. NASDAQ 100 futures are down 0.9% at the time of writing, while the S&P 500 futures are off nearly 0.7%.
AT&T earnings news: EPS down 22% YoY
AT&T produced adjusted earnings per share of $0.60 in the first quarter, one cent above consensus, but free cash flow in the quarter was just $1 billion. Adjusted EPS dropped from $0.77 in the first quarter of 2022, meaning that EPS fell 22% YoY. Management chose to speak with gusto about its 5G future, which saw heavy capex spending in the quarter.
"Our teams take pride in connecting more people to greater possibility through 5G and fiber," said CEO John Stankey. "We're winning thanks to a proven and sustainable playbook that centers on simple, customer-centric experiences. As a result, we're adding high-value customers, and when they choose AT&T, they stay with us. The work we're doing today is establishing a foundation for durable, long-term growth, and we remain confident in our full-year guidance."
Cash from operations came in at $6.7 billion, but much of that went to capex spending of $4.3 billion. Mobility, Mexico and Consumer Wireline revenues were offset by the Business Wireline segment. One point of positivity was operating expenses falling by $100 million YoY to $24.1 billion.
Net debt of $134.7 billion weighed on the company due to the higher interest rate environment.
AT&T stock forecast
AT&T stock is headed back to mid-March's support at $18.07, where three separate sessions in a row discovered a base there. Below that is the $17.85 support line from December 19 and 20 of last year. The stock broke well below the 21-day moving average during the premarket sell-off, which is a good sign that the pullback will continue. The Moving Average Convergence Divergence (MACD) also looks ready to crossover in a bearish fashion.
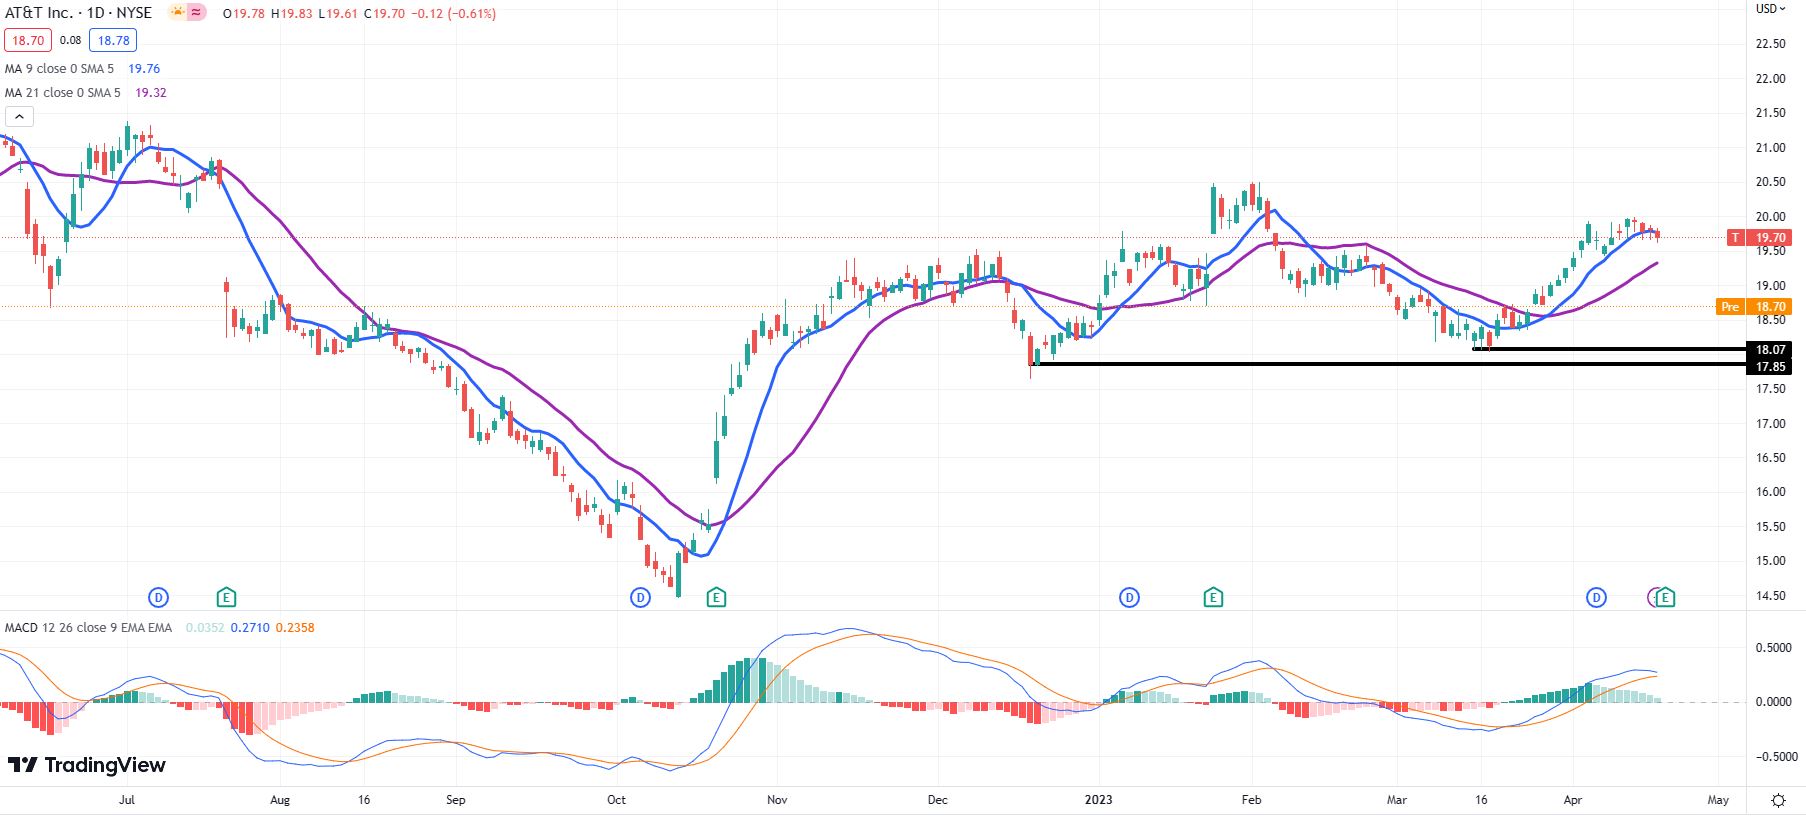
AT&T daily chart
Author

Clay Webster
FXStreet
Clay Webster grew up in the US outside Buffalo, New York and Lancaster, Pennsylvania. He began investing after college following the 2008 financial crisis.














