Did the AI bubble just burst? Semiconductor index sees worst sell-off since Covid
- Dan Ives contends that Democratic midterm win means peak AI capex will arrive in 2027 instead of late in the decade.
- Thursday's semiconductor plunge is worse than June 5 sell-off.
- SOX index plunge is worst performance for semiconductors since March 16, 2020 Covid crash.
- All 30 semiconductor constituents in SOX trade lower.

It's bad out there. Analyst concern that the AI data center buildout could peak in 2027 instead of later in the decade has led to a complete meltdown among semiconductor stocks on Thursday, the central beneficiary of that buildout.
The Philadelphia Semiconductor Index (SOX) is trading as much as 11% lower after star analyst Dan Ives of Yorkville Ives suggested on X.com that while hyperscaler capex still exceeds $1 trillion next year, growth will likely moderate in 2028 as Democratic governors and state houses attempt to regulate the industry locally.
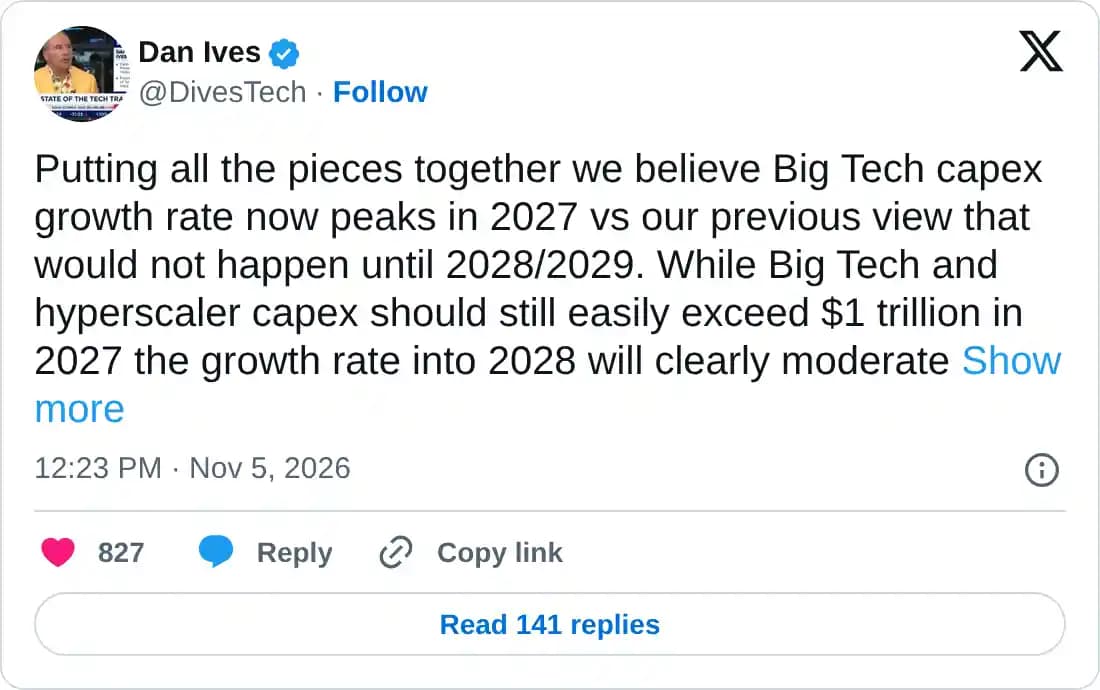
The viewpoint is significant since Ives has been maybe the loudest cheerleader of the AI boom and one of the foremost bulls among the semiconductor stocks that lead it.
The SOX index's double-digit intraday drop on Thursday is the worst performance for the index since the Covid panic sent the index down 15.9% on March 16, 2020. Thursday's wipeout is also reminiscent of the June 5 performance this year when the SOX buckled 10.3% lower on the back of a poor earnings performance from Broadcom (AVGO).
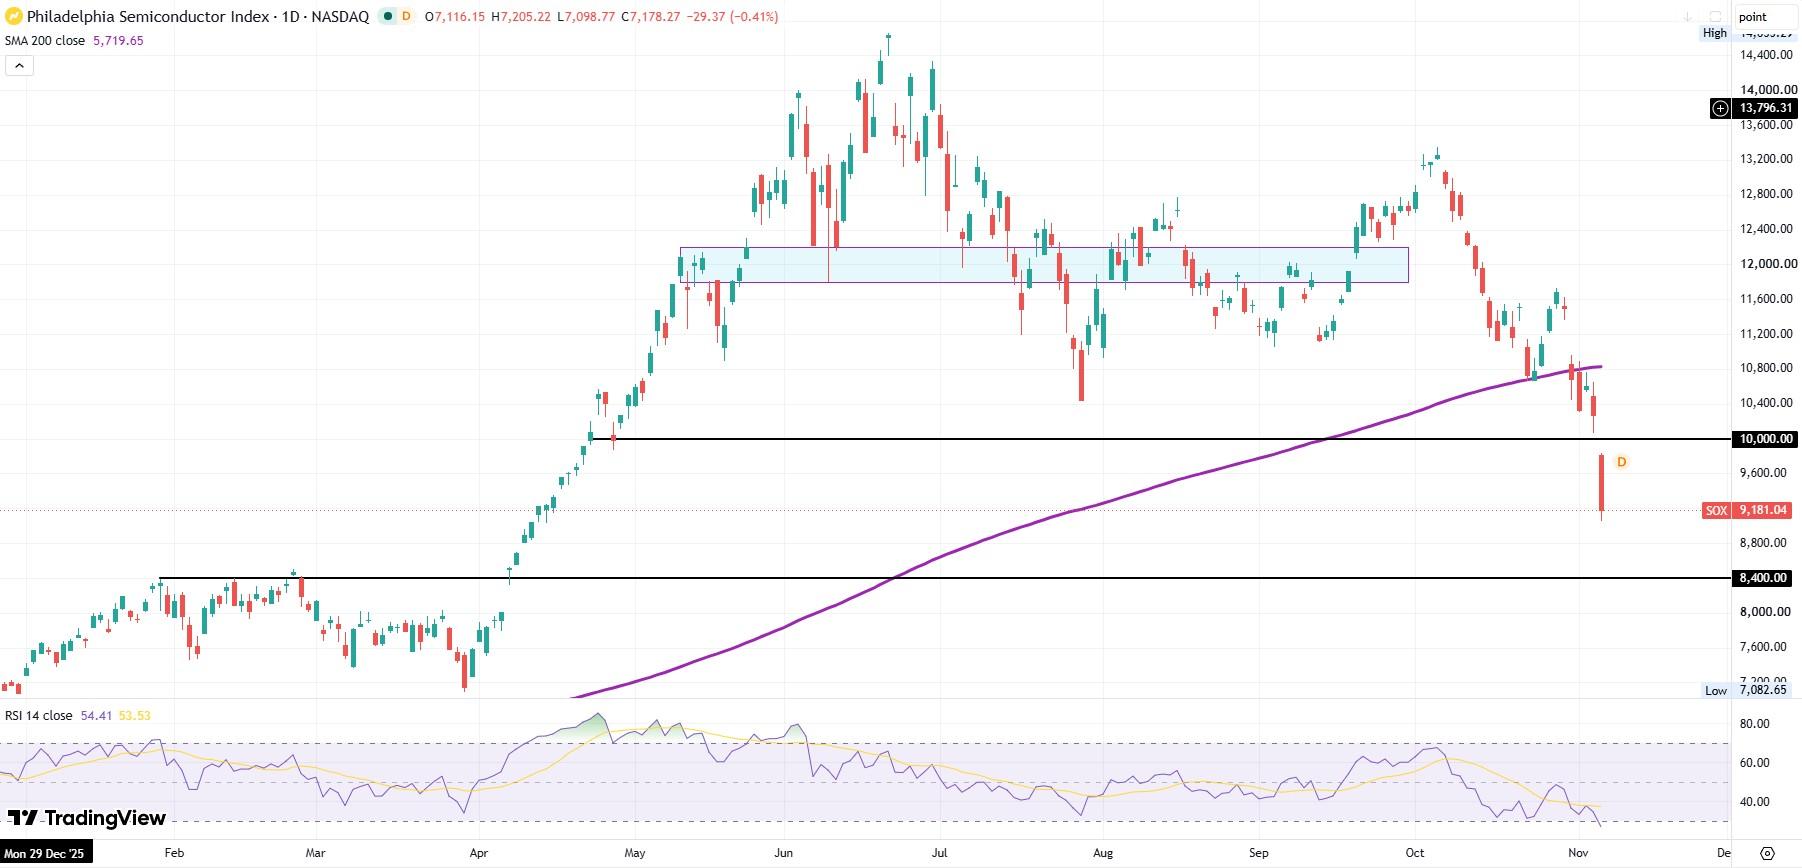
On Thursday, all 30 of the SOX holdings were trading lower. These include huge holdings like the aforementioned Broadcom and Nvidia (NVDA), both down over 8% at the time of publishing, and much smaller weightings like Cerebras Systems (CBRS) and STMicroelectronics (STM), both down over 10%.
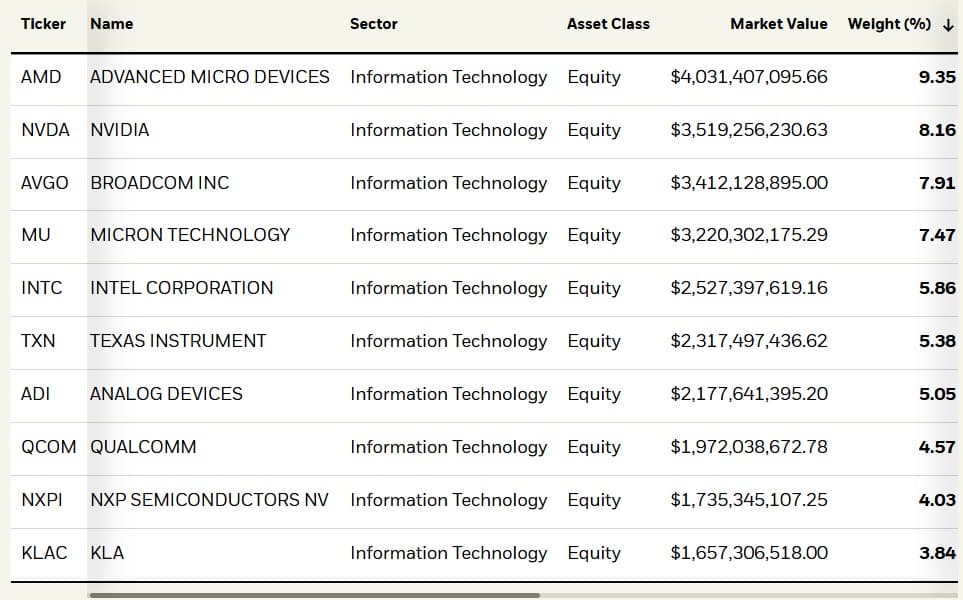
Philadelphia Semiconductor Index (SOX) chart
The SOX was already trading below the 200-day Simple Moving Average coming into Thursday's session, so the market already knew the index was in a downtrend. But Thursday's plunge introduced a gap down scenario for SOX, which opened below prior support at the 10,000 psychological level.
At this depth, the next available historical formation on the daily chart is the 8,400 level that proved to work as resistance during the January and February portion of the year. Already in overbought territory on the Relative Strength Index (RSI), if SOX retests 8,400 it would require the index to drop another 8.5%.
Author

Clay Webster
FXStreet
Clay Webster grew up in the US outside Buffalo, New York and Lancaster, Pennsylvania. He began investing after college following the 2008 financial crisis.