Canadian Dollar edges up against US Dollar ahead of US CPI data
- The Canadian Dollar ticks higher against the US Dollar in the countdown to the US CPI data.
- According to estimates, both US headline and core inflation figures to arrive higher than August’s readings.
- Higher oil prices continue to lend support to the Canadian Dollar.
The Canadian Dollar (CAD) trades slightly higher against the US Dollar (USD) on Wednesday ahead of the United States (US) Consumer Price Index (CPI) data at 12:30 GMT. In the Asian trade, the USD/CAD pair is marginally down to near 1.4200, as the US Dollar extends its decline.
As of writing, the US Dollar Index (DXY), which gauges the Greenback’s value against six major currencies, trades 0.1% lower to near 102.11. The DXY has retreated from its yearly high of 102.61 posted on Monday.
The US CPI report will likely to show that the headline inflation rose to 3.6% Year-on-Year (YoY) from 3.4% in August. The core CPI – which excludes volatile food and energy items – is seen arriving at 2.5% YoY, higher than the previous reading of 2.4%. The inflation data is expected to have a significant impact on Federal Reserve’s (Fed) interest rate expectations.
Currently, the CME FedWatch tool shows traders are confident that the Fed will leave interest rates unchanged in the policy meeting later this month and will deliver a hike in December.
Strategists at Societe Generale highlight Wednesday’s US CPI release as the key near-term driver for Fed expectations, arguing that a move in core inflation to “2.5% (the market consensus)” would leave the policy outlook largely unchanged. In their view, such a print would imply “little chance of any shift in market expectations: no rate hike this month, but a very strong chance of one in December and another in Q1.”
On the Loonie front, rising oil prices due to continued conflicts between Saudi Arabia and Iran-backed Houthis would keep lending support to the currency. The appeal of the Canadian Dollar improves in a high-oil-price environment, given Canada is net exporter of oil. The WTI Oil price has increased little over $96.00 from its six-week low of $86.32 posted last week.
USD/CAD Technical Analysis
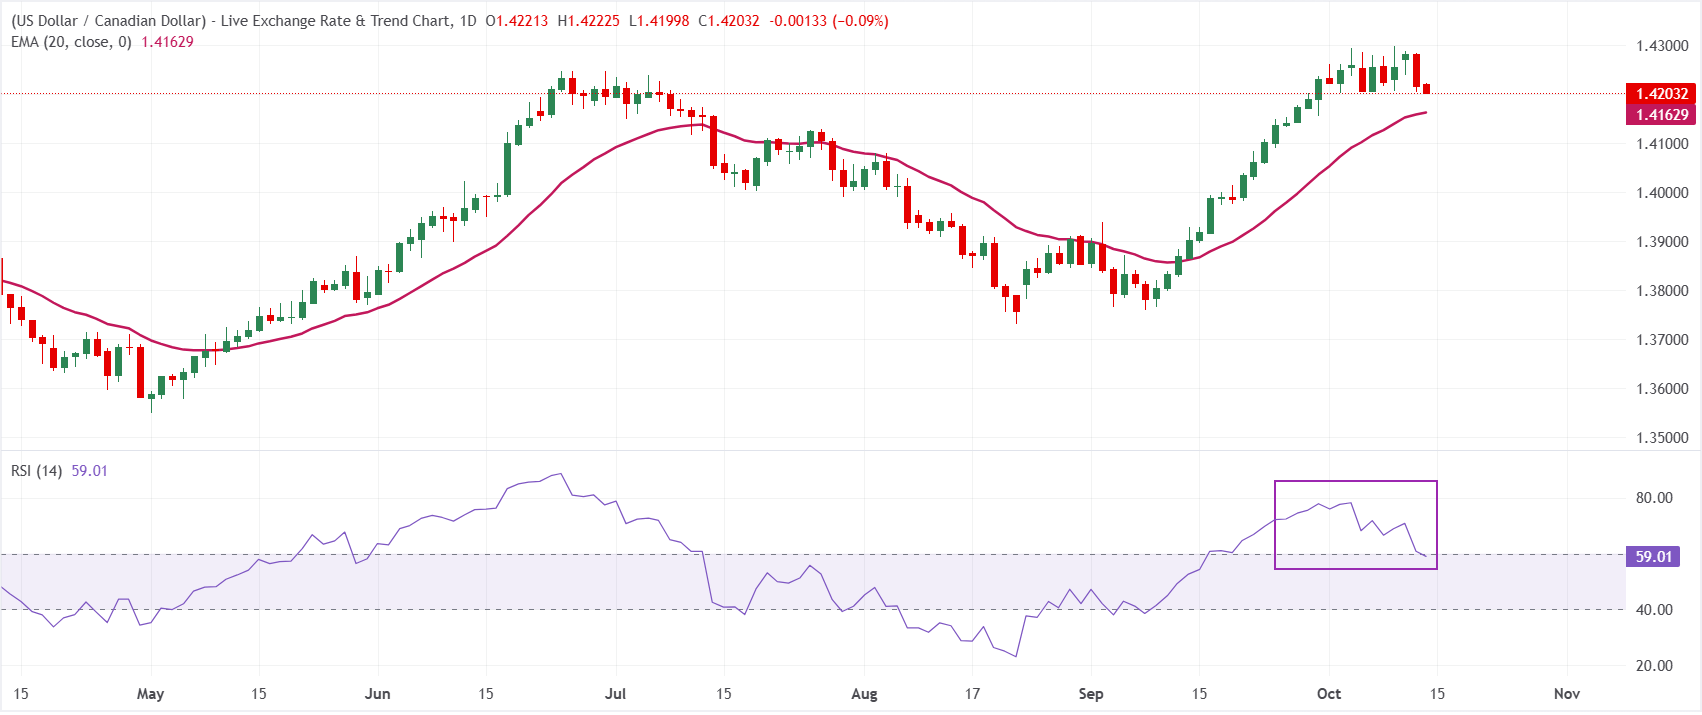
In the daily chart, USD/CAD trades at 1.4203. The pair holds a bullish near-term bias as it remains above the 20-period exponential moving average (EMA) at 1.4163, suggesting that recent upside momentum is still supported by trend-following flows. The Relative Strength Index (14) at 59.0 stays in positive territory but shy of overbought levels, hinting that buyers retain control while leaving room for further gains before conditions become stretched.
On the downside, immediate support is seen at the 20-day EMA at 1.4163, which guards the latest advance and would need to give way to signal a deeper corrective phase. While no clear resistance markers are provided by the current dataset, the prevailing structure suggests that only a decisive drop back below the EMA would weaken the bullish tone and expose USD/CAD to a broader consolidation or pullback phase.
(The technical analysis of this story was written with the help of an AI tool. Know more.)
Economic Indicator
Consumer Price Index (YoY)
Inflationary or deflationary tendencies are measured by periodically summing the prices of a basket of representative goods and services and presenting the data as The Consumer Price Index (CPI). CPI data is compiled on a monthly basis and released by the US Department of Labor Statistics. The YoY reading compares the prices of goods in the reference month to the same month a year earlier.The CPI is a key indicator to measure inflation and changes in purchasing trends. Generally speaking, a high reading is seen as bullish for the US Dollar (USD), while a low reading is seen as bearish.
Read more.Next release: Wed Oct 14, 2026 12:30
Frequency: Monthly
Consensus: 3.6%
Previous: 3.4%
Source: US Bureau of Labor Statistics
The US Federal Reserve (Fed) has a dual mandate of maintaining price stability and maximum employment. According to such mandate, inflation should be at around 2% YoY and has become the weakest pillar of the central bank’s directive ever since the world suffered a pandemic, which extends to these days. Price pressures keep rising amid supply-chain issues and bottlenecks, with the Consumer Price Index (CPI) hanging at multi-decade highs. The Fed has already taken measures to tame inflation and is expected to maintain an aggressive stance in the foreseeable future.
Author

Sagar Dua
FXStreet
Sagar Dua is associated with the financial markets from his college days. Along with pursuing post-graduation in Commerce in 2014, he started his markets training with chart analysis.

















