The secret to win is to learn from losses

Not all trades work
I have previously shared some my before & after trade details, mostly of those that provided a profit. But it is from the ones that do not work that you learn more from about. So in this short article I have shared the details of the DAX short trade that went against us. Hopefully you will learn a thing or two from this article.
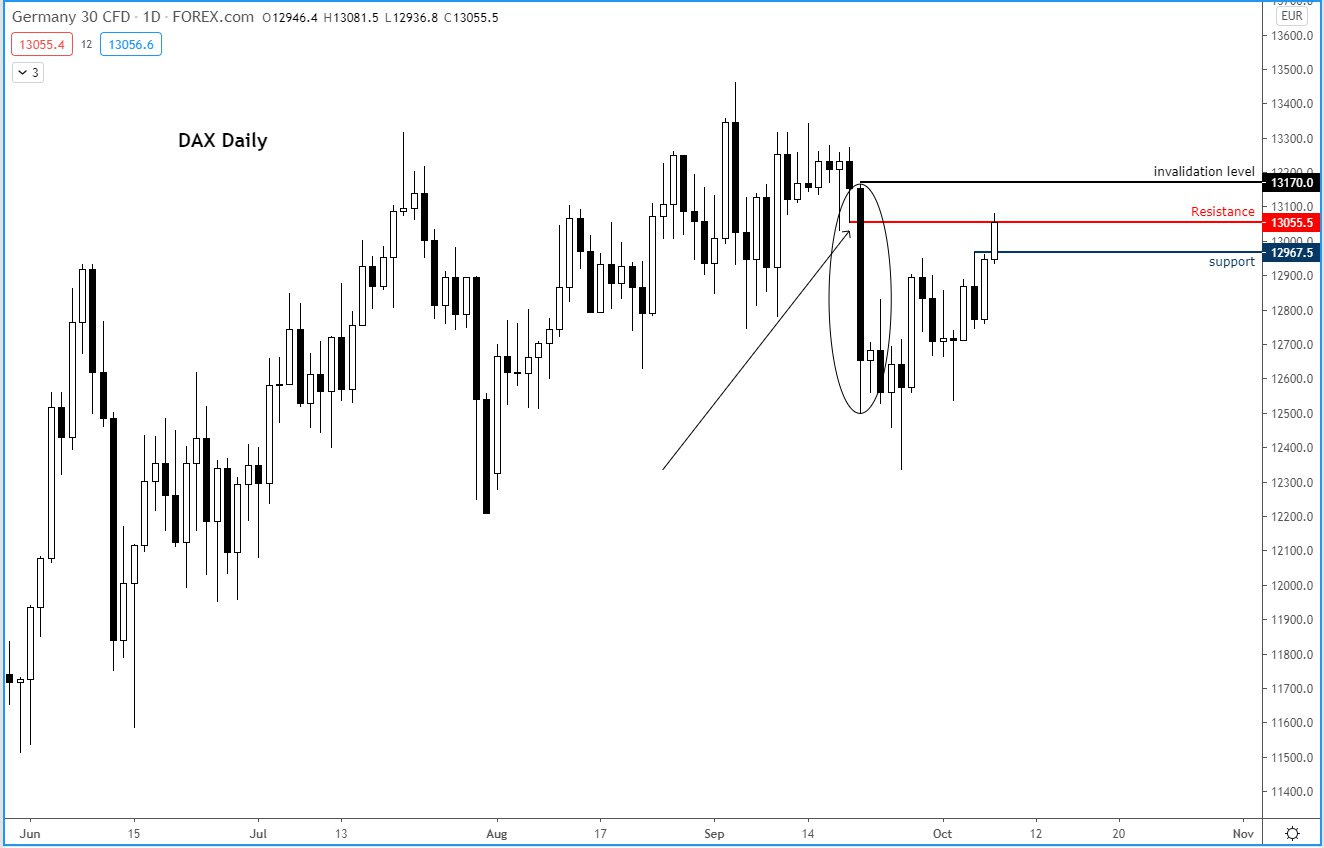
I issued the short trade signal to the group when noticing the DAX had hit resistance on Thursday 8th October 2020. This is what I wrote to the group:
DAX Daily testing resistance – potential short opportunity could be on the cards here as the index tests the point of origin of the breakdown (where the arrow is pointing to). If we find one, we will use the high of that big red candle as our invalidation.
Source: TradingCandles.com and TradingView.com
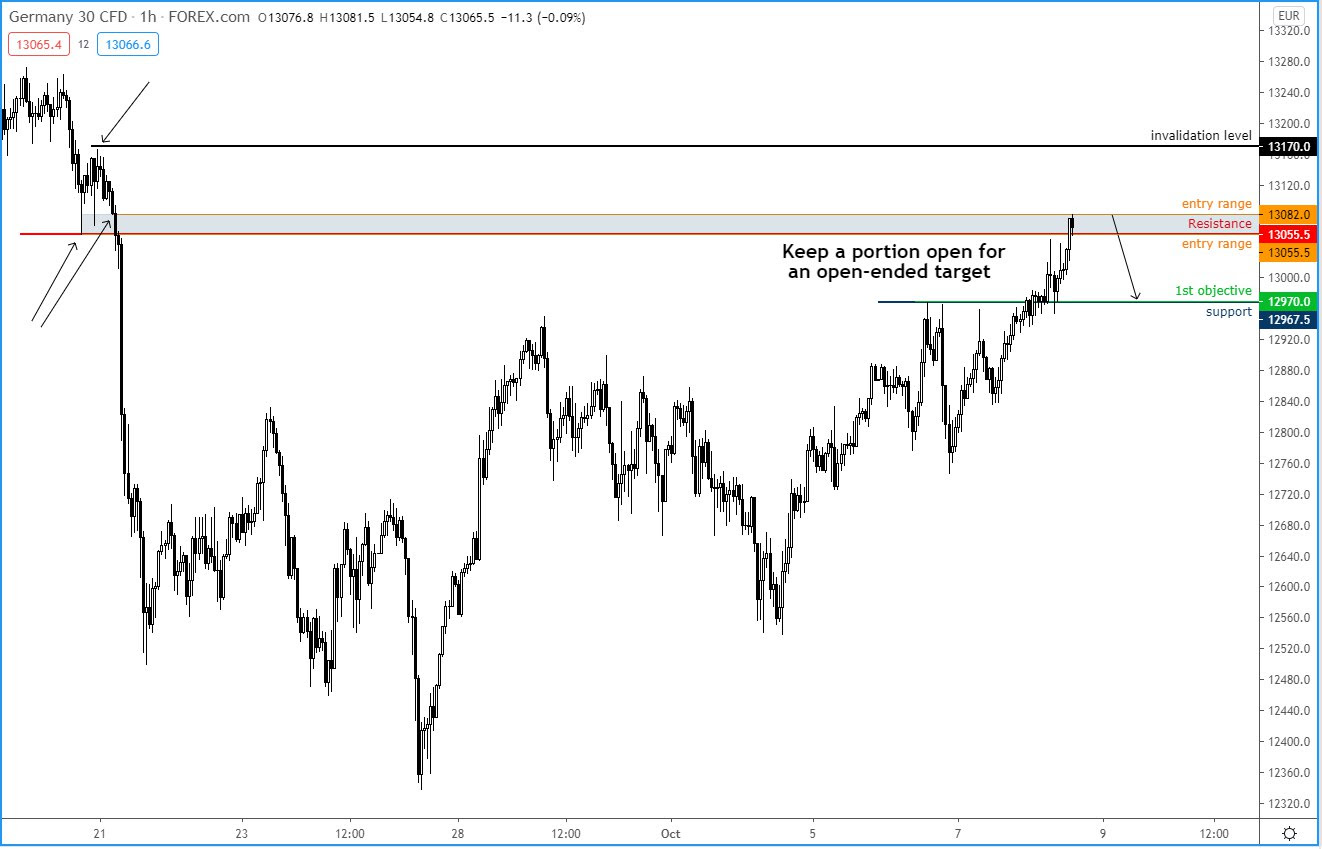
Based on the above daily chart, I then looked for an entry, as I normally do, on the hourly time frame:
DAX short trade idea – we are fading into the rally as the index tests prior breakdown point. Once support, this area could turn into resistance. I am looking for a big move lower, so the first objective is to merely fund the trade – IF we get there, make sure to take some profit and then lower the stop on the remainder for a potential drop.
This is the first short attempt on an index in many months. I think there are a number of major fundamental risks that are not being priced in by markets e.g. brexit, covid resurgence across the eurozone etc.
Source: TradingCandles.com and TradingView.com
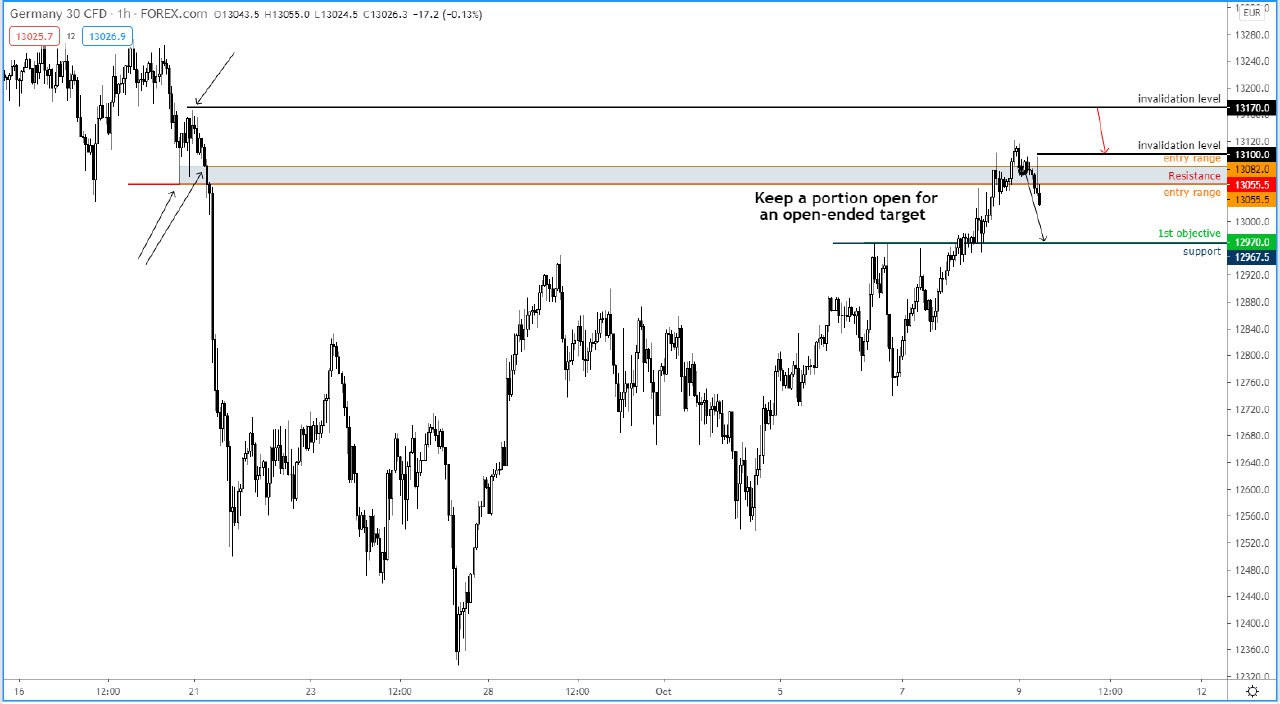
As we were going against the trend, it is always important to manage risk. I was getting worried this trade will not work because of the rallying equities on Wall Street, though the DAX was already more subdued…
DAX update: time to move the stop lower, I think. I have moved mine to above this hourly inverted hammer candle. After the big rally on Wall Street, there is a risk this could go against us, so lets reduce the risk as much as possible.
Source: TradingCandles.com and TradingView.com
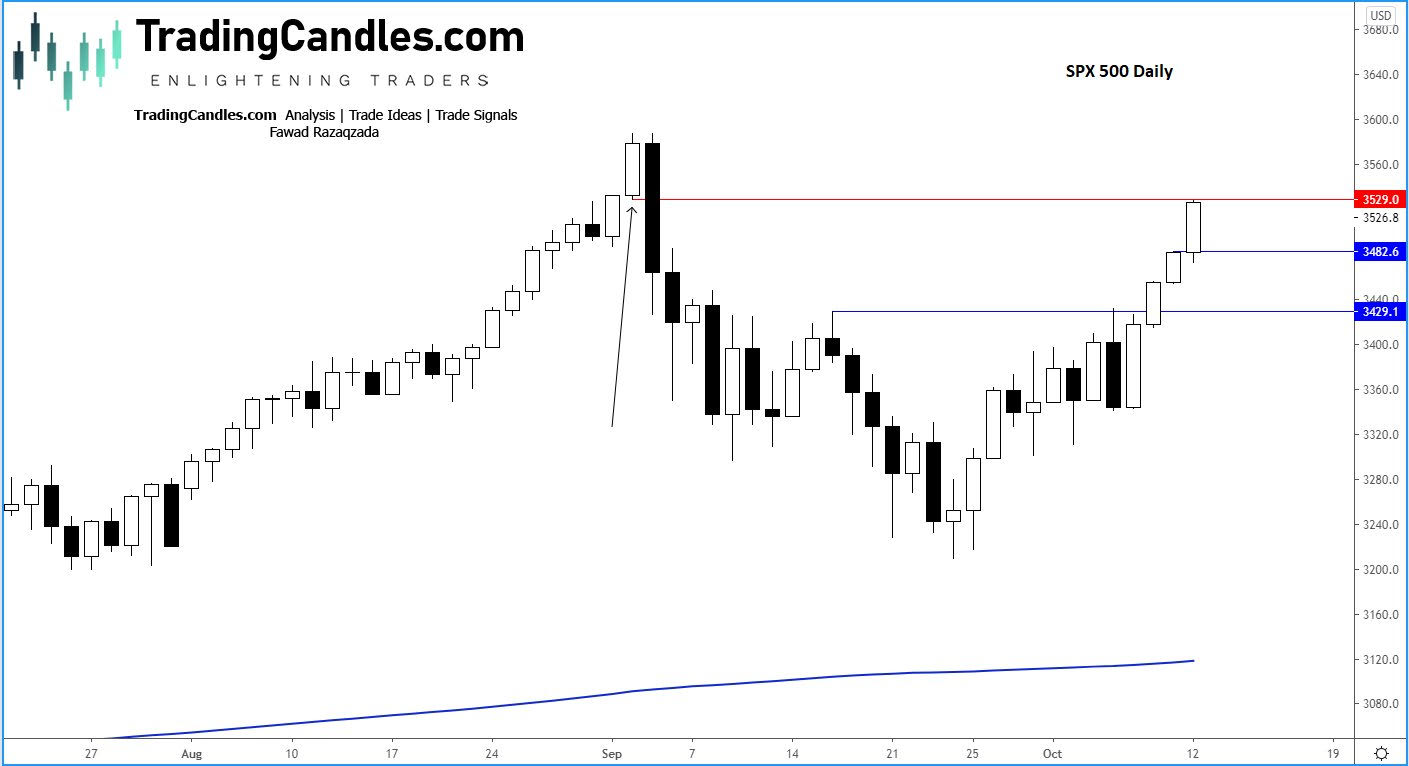
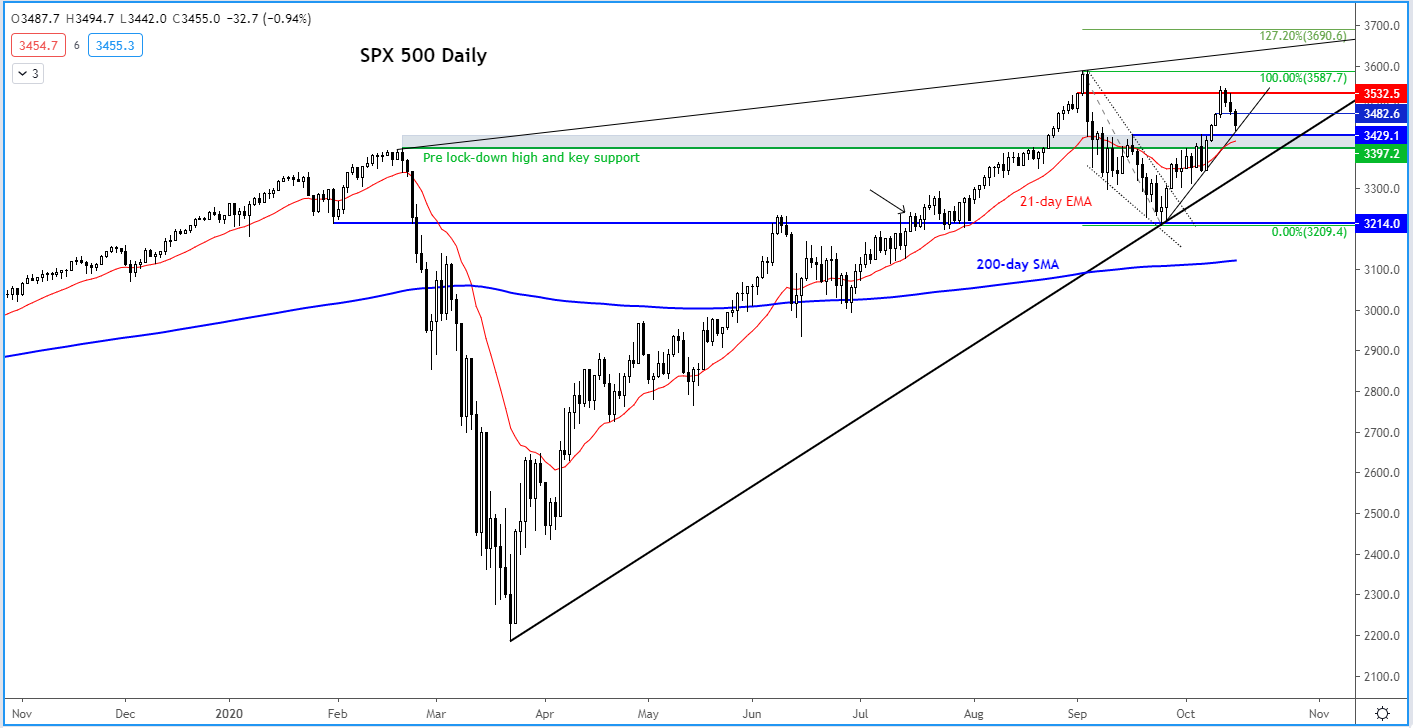
Meanwhile, the S&P 500 was also hitting resistance, which further strengthened the bearish case:
Source: TradingCandles.com and TradingView.com
A few days later this is how the S&P looked like:
Source: TradingCandles.com and TradingView.com
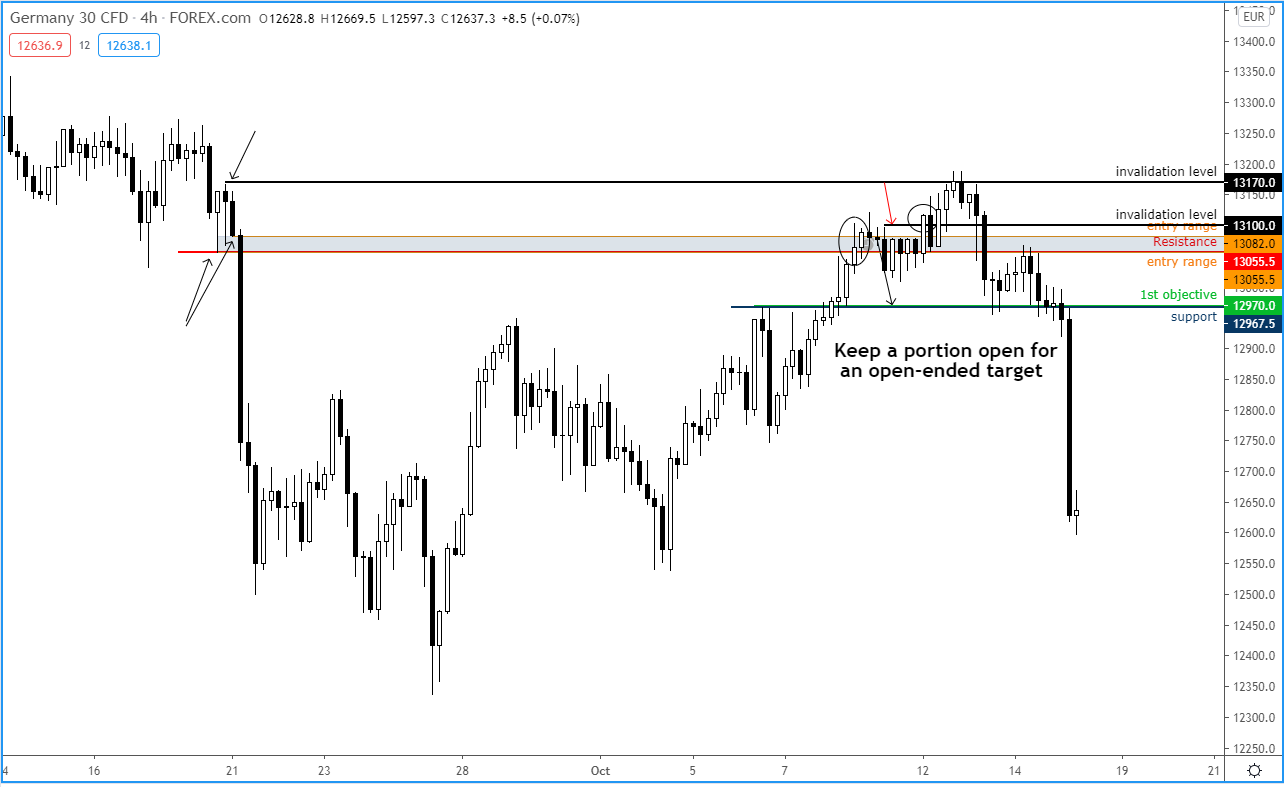
However, the DAX had rallied again – triggering our adjusted stop loss for a small loss in the process – before tanking!
Source: TradingCandles.com and TradingView.com
So, we got very unlucky with our short on the DAX – would have worked wonderfully if we had timed our entry better. This underscores why it is very important to time the market correctly even when you have a very strong feeling about a particular trade. I was almost convinced the DAX was going to drop because of rising virus cases and other fundamental risks, but mis-timed the trade.
This is the nature of trading, but it is important we learn lessons from our losses, even though we lost very little in the DAX as we had tightened the stop loss very close to the entry. If we hadn’t done so, we would have taken a full 1R loss.
Another lesson from this is that when going against the trend, it is always a good idea to wait for the trigger. We didn’t wait for a proper breakdown, as we sold the first rounded re-test of resistance on the daily. Had we waited a day or so, when the index made a lower low on the hourly after the latest break higher had failed, then we would have had some confirmation to work with.
But what do we do now?
We don’t want to chase a market which is down about 2.5% lower on the session – that is going to be very risky. Equally, we also don’t want to be buying the dip either, as the losses could certainly extend on the session. We need technical evidence that the market has carved out a short-term bottom, before looking for a potential long trade, or wait until a small pullback to some resistance level before looking for new shorts.
More opportunities will show up, we need to remain patient.
Author

Fawad Razaqzada
TradingCandles.com
Experience Fawad is an experienced analyst and economist having been involved in the financial markets since 2010 working for leading global FX, CFD and Spread Betting brokerages, most recently at FOREX.com and City Index.















