The market trap that quietly destroys most trading signals

Most traders spend their time looking for trends.
Here's the problem.
Markets don't trend nearly as often as people think they do.
In fact, research suggests that markets are in a strong trend only about 15% of the time.
What happens during the other 85%?
Trading ranges, "sideways to up" and "sideways to down" trends, pullbacks, corrections.
And this is where most traders get hurt.
Your indicators fire. Your entry signals appear.
Everything looks perfectly normal.
But there is one problem: there is no real trend to capture.
The result?
False signals, unnecessary losses, frustration, and the feeling that the market is always one step ahead of you.
I spent years trying to solve this problem.
Not by guessing.
Not by drawing lines wherever I wanted them to be.
But by developing a quantified, objective, rules-based method for identifying trading ranges in real time.
Eventually, I incorporated these rules into the advanced version of MACD-v: MACD-v Pro, together with a few additional techniques I'll reveal tomorrow.
For now, I want to show you exactly what a rules-based trading range looks like on a chart.
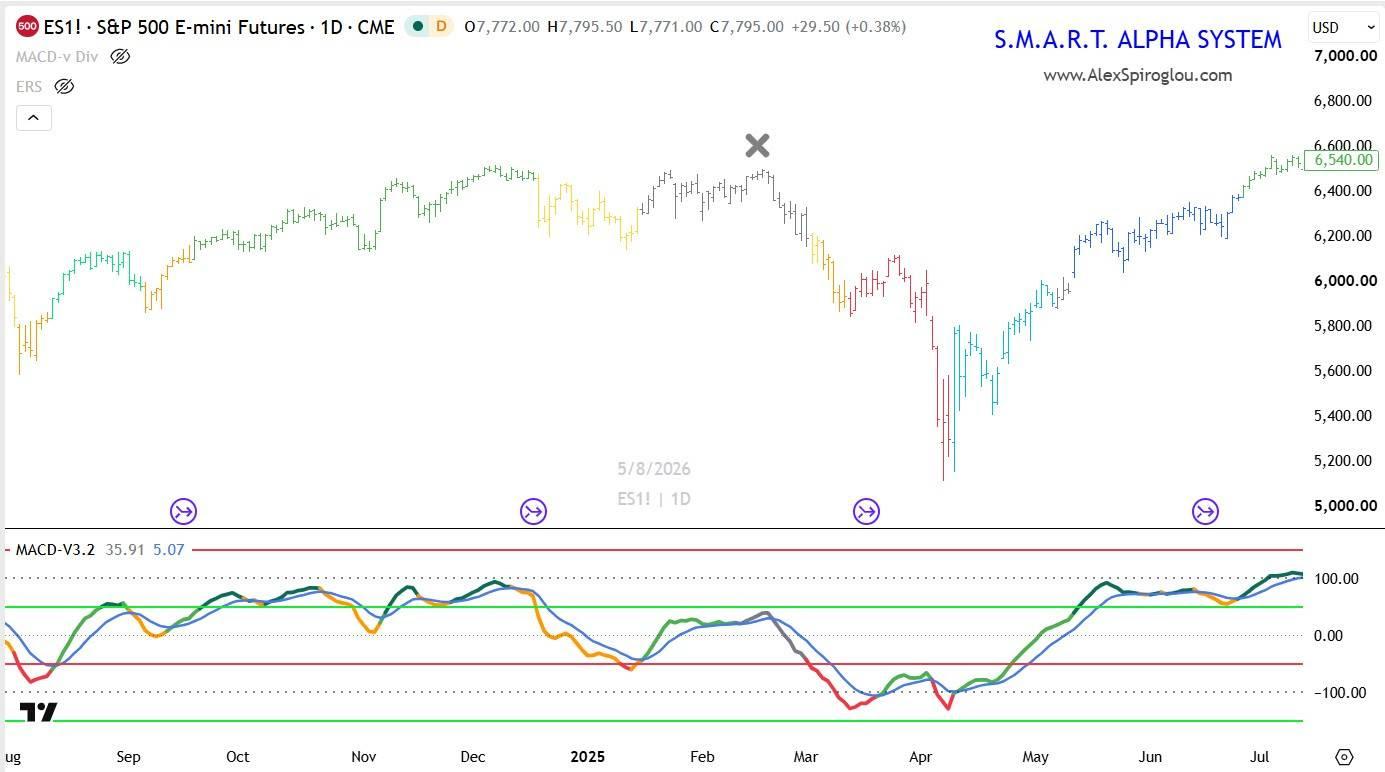
Here's the first example on the S&P 500 with the "trading range" area colour coded as grey, I have also marked manually with an "X"
Here is another example on the S&P 500
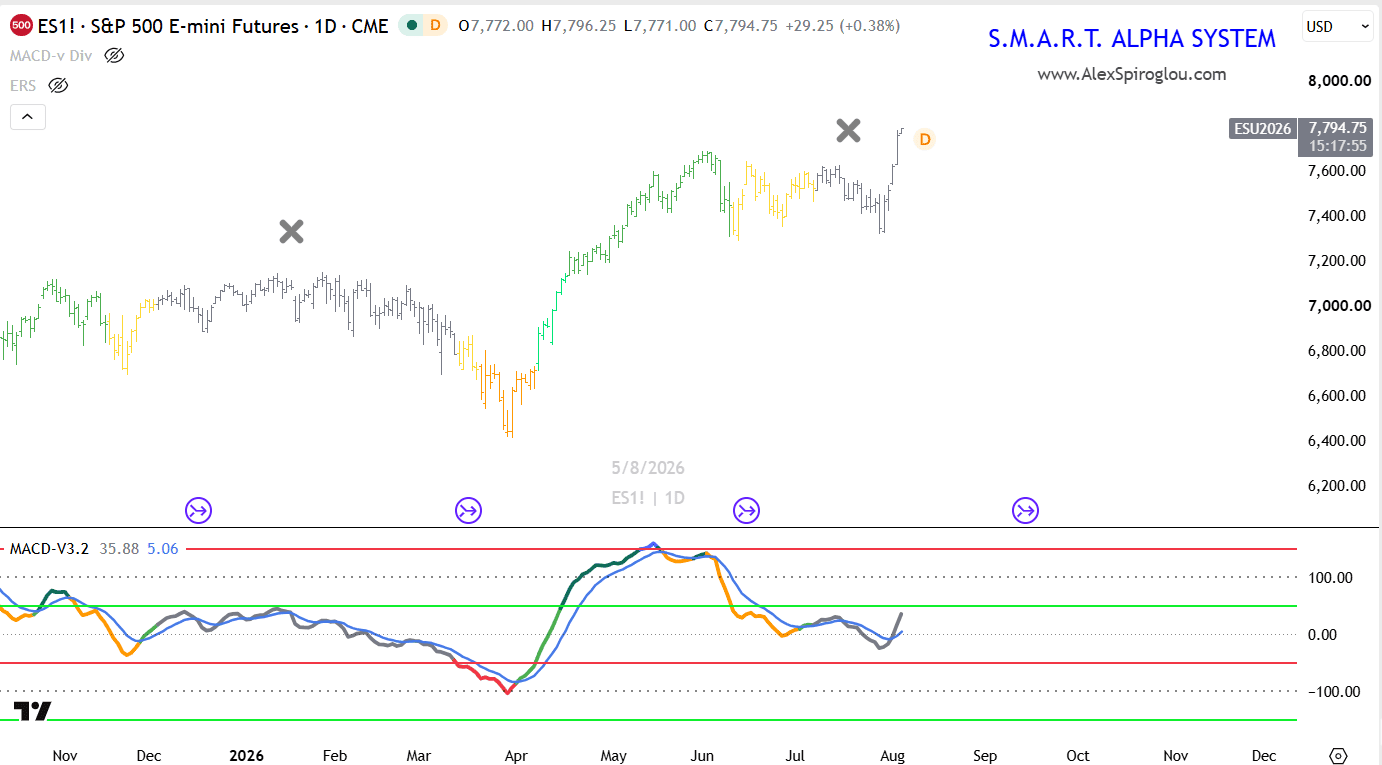
These conditions are REAL TIME, and do not "repaint".
I do not take any signal while in a trading range, until I have a qualified breakout.
That is why trading is a game of discipline and patience
Author

Alex Spiroglou, CFTe, DipTA (ATAA)
Independent Analyst
Alex Spiroglou is a quasi-systematic, cross-asset proprietary futures trader. His involvement with capital markets began in 1998, having worked for various proprietary trading and investment management firms in the UK and Greece.
















