The expected market pullback most traders will miss again

Markets rarely reward consensus in the way most participants expect. Right now, a large portion of traders are anticipating a pullback. But anticipation alone does not translate into execution. In reality, most participants will enter too early, hesitate when the opportunity appears, or miss the move entirely.
This is not randomness—it is the result of structural market dynamics, liquidity behavior, and deeply ingrained psychological biases. The pullback may be expected. Capitalizing on it is not.
The execution gap: Why expectation fails
There is a persistent gap between what traders expect and what they actually do. When markets begin to pull back, some traders enter prematurely and get stopped out. Others wait for confirmation and miss optimal entries. Many freeze as volatility increases and uncertainty rises. By the time the opportunity becomes “obvious,” it is often already gone. This pattern repeats because markets are designed to exploit hesitation and emotional decision-making.
Our approach: A different use of Elliott Wave theory
At ElliottWave-Forecast, we apply Elliott Wave Theory differently from the traditional approach. Over the years, we have developed a rule-based system focused on: Identifying trend changes early, defining high-probability entry zones, and executing within the dominant trend—not against it. This framework allows us to act when others hesitate, especially during periods of panic or dislocation.
We demonstrated this during: The Covid crash in 2020.
The April 2025 market pullback
These events did not surprise us. Not because we predict news, but because we track market cycles and structure. Preparation, not prediction, is what enables execution.
The current market: The warning was already there
Earlier this year, we identified warning signs pointing to the current pullback. This is not just across indices, but also within key individual stocks like Delta Air Lines (DAL).
From the April 7th low, Delta developed a clear five-wave impulsive structure. Within our framework, a completed 5-wave sequence is not just a continuation signal. It is often a warning that the underlying cycle is approaching exhaustion. What made this particularly important is that the structure was clean and complete. In addition, the sequence aligned with broader market extensions. It signaled that the cycle from April 7th was maturing.
This was not an isolated observation. When we see five-wave completions in leading or highly liquid stocks, it often reflects a broader shift developing across the market. In other words, Delta was not just moving, it was sending a signal. A signal that the market was nearing the end of its current cycle and that a pullback phase was becoming increasingly likely.
When news follows structure
It often appears that news “causes” market moves. In reality, markets frequently price in structure first, and news follows. The recent Iran conflict is a clear example. Once tensions escalated, markets reacted in a textbook risk-off manner: Oil prices surged on supply disruption concerns, energy stocks rallied, major indices (S&P 500, Nasdaq) pulled back, and high-beta assets (tech, small caps) sold off aggressively. This creates a feedback loop of fear. Traders shift into risk-off mode, often abandoning the broader trend entirely.
The nature of pullbacks: Messy by design
Pullbacks are rarely clean. They are typically volatile, overlapping, and emotionally difficult to trade. This is because corrections unfold in complex sequences, not straight lines. In our methodology:
Corrective structures develop in 3, 7, or 11 swings
Impulsive trends extend in 5, 9, 13, 17, or 21 swings
These extensions refine traditional Elliott Wave principles and allow for more precise timing. Geopolitical events amplify this complexity by compressing opportunity windows, increasing volatility, and distorting trader behavior. This is exactly why most traders miss the move they were waiting for.
Removing emotion: A rule-based framework
Success in this environment requires structure—not intuition. Our process is straightforward:
Identify the dominant trend.
Wait for corrective sequences (3-7-11).
Execute within predefined zones.
Let the market confirm the outcome.
We also use what we call Blue Box zones—areas derived from:
Wave structure.
Sequence relationships.
Fibonacci extensions.
These zones provide high-probability reaction areas, with historical accuracy approaching 85%.
Where we are now
The market has now reached a key reaction area we identified weeks ago. This is not a moment to chase price. It is a moment to observe structure and prepare for the next move.
The latest META daily chart reflects this clearly:
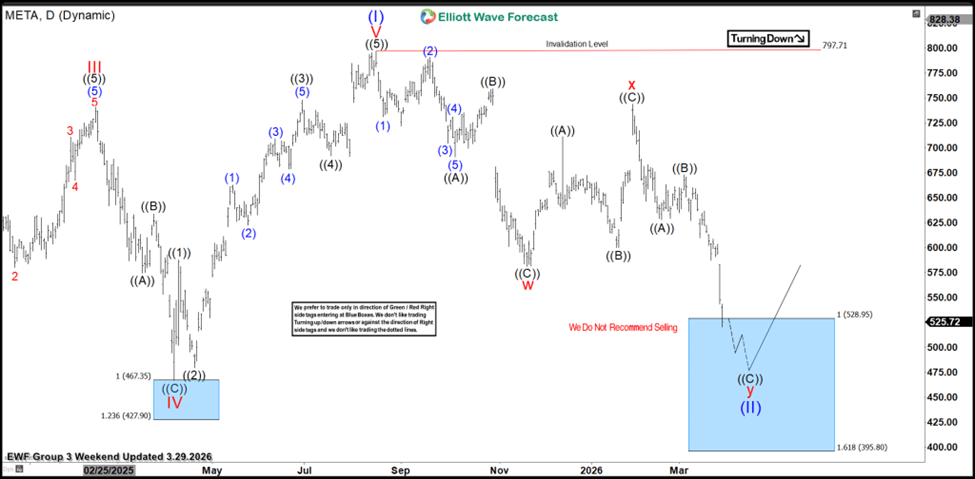
META shows a completed impulsive sequence, followed by a three-wave corrective pullback. Now it supports the case for a near-term bounce. The minimum target has been achieved. From here, we allow the market to confirm direction while positioning for what could evolve into a much larger move.
Final thought: Systems over emotion
No system is perfect. But trading without a system guarantees inconsistency. Markets will always:
Create fear at the bottom.
Create euphoria at the top.
Punish emotional decision-making.
The objective is not to be right 100% of the time. The objective is to operate with a structured edge. Because in the end, the difference is not who sees the move coming. It’s who is actually prepared to act on it.
Author

Elliott Wave Forecast Team
ElliottWave-Forecast.com















