Position sizing after a loss: Why the buffer matters more than the stop
Ask a trader what size they use and most will answer in terms of the account: a standard lot on a $100,000 account, a fixed percentage of balance, a number that came with the funding. Ask what happens to that number after three losing days and the answer is usually that it does not change.
That is the gap where funded accounts are lost, and it has nothing to do with entry quality.
The number that actually ends the account
An account does not close because the balance fell. It closes because equity touched a specific level: the drawdown floor, whether that floor is static at a fixed percentage of starting capital or trailing behind your equity high.
The distance between where you are and where that level sits is the only number with a hard consequence attached. Everything else — balance, account label, tier — is descriptive.
That distance moves constantly, and rarely in your favour. It shrinks with every losing trade. On a trailing structure it shrinks permanently with every withdrawal, because the floor follows equity upward and does not come back down. It grows only when you make money and hold it.
Position size keyed to the account label ignores all of this. The size that was appropriate with $3,000 of room is not appropriate with $1,200, but nothing in a tier-based sizing rule notices the difference.
The arithmetic
Express your buffer in stops rather than currency and the problem becomes visible immediately.
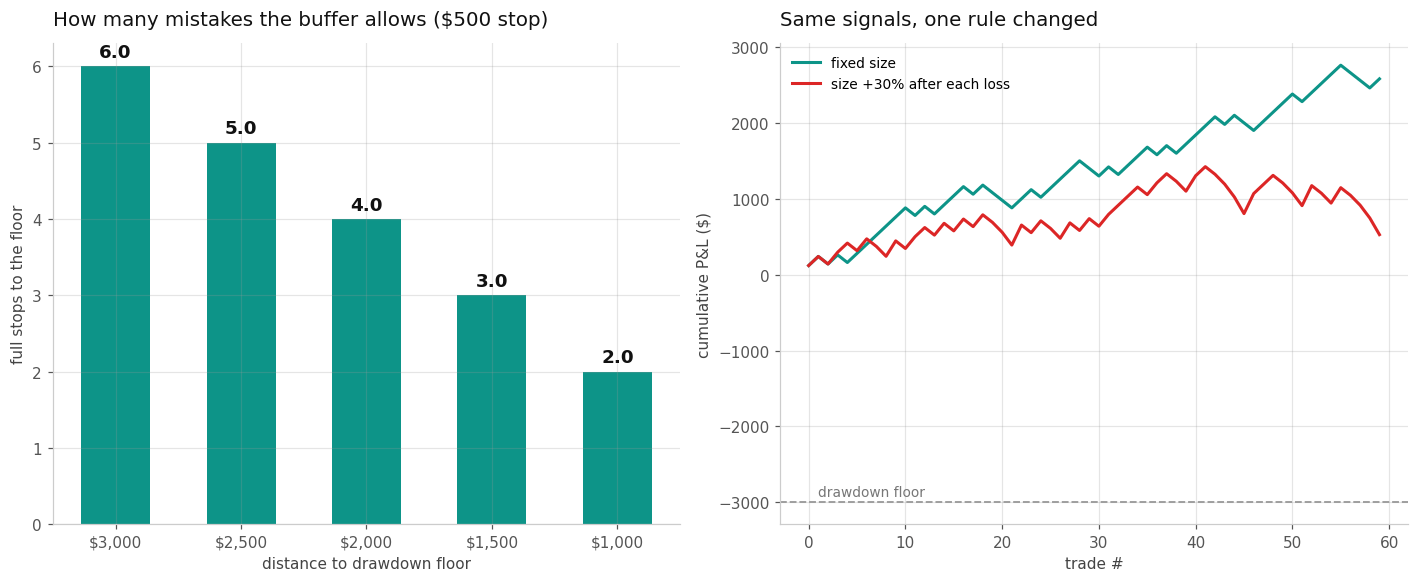
With $3,000 of room and a $500 stop, you have six full mistakes before the account is gone. That is a workable margin: at a 55% win rate, the probability of hitting six consecutive losses somewhere in a hundred trades is around a third.
Halve the buffer to $1,500 without changing size, and you have three. The probability of encountering three consecutive losses in the same hundred trades is essentially certain.
Nothing about your strategy changed. Your win rate is the same, your edge is the same, your stop is in the same place. The only thing that moved is the room behind the stop, and the account went from "survives a normal bad run" to "does not."
Why this compounds after a loss specifically
There is a documented behavioural layer sitting on top of the arithmetic.
A 2005 study published in the Journal of Finance examined trading records from proprietary traders at the Chicago Board of Trade — full-time professionals with personal capital at risk. Traders who lost money in the morning took above-average risk in the afternoon 31.2% of the time, compared with 27% for those who had made money. They also traded more frequently and built larger positions after a losing morning.
Note the population. These were not novices working through a learning curve. If the effect persists at that level of experience, it is better understood as a predictable response to a realised loss than as a character flaw.
Put the two together. The buffer shrinks after a loss, and the disposition to increase size rises after a loss. The two move in opposite directions at exactly the same moment, and the account sits in between.
What a rule looks like
The research suggests the control cannot be applied in the moment, because the moment is when judgment is least reliable. Written in advance, it can be.
Three rules cover most of the exposure.
Size against the buffer, not the account. Before each session, calculate the distance to your floor and divide by your typical stop. If the answer is under three, you are not in a position to trade normal size. Reduce until the ratio recovers, then restore.
Set a post-loss interval in advance. The specific length matters far less than the fact that it was chosen before the loss occurred. Fifteen minutes away from the platform after a stop-out removes the window in which the documented effect operates.
Re-size after every withdrawal. On a trailing structure, a payout is a permanent reduction in room. The floor does not move down with your balance. If you take out a meaningful portion of your buffer and continue at the same size, you are trading a smaller account with the sizing of a larger one.
None of these require you to perform under pressure. That is their entire value: each one is a decision made by a version of you that has not just lost money, executed by a rule rather than by judgment.
Testing it on your own record
This is checkable on your own data in under half an hour, and the exercise is more persuasive than any argument.
Export your trade history. For each trade, identify whether the preceding closed trade was a win or a loss, and tag it. Then compare the two groups on three metrics: average position size, win rate, and time elapsed between the previous close and the new entry.
If the post-loss group carries larger average size, the behavioural effect is present in your own record regardless of what you believe about your discipline. If the interval is shorter, the timing effect is present. Most traders running this for the first time find at least one, and find it surprising, because those trades did not feel different at the time. They felt like conviction.
That gap — between how the trade felt and how the group performed — is the measurable part of trading psychology, and it is sitting in a CSV file you already have.
Disclaimer: This article is for educational purposes only and does not constitute investment advice or a recommendation to trade. Past performance does not guarantee future results.
Author

Puravida Edge Analysis Team
Puravida Edge
The Puravida Edge Analysis Team researches systematic trading approaches for prop firm and funded traders, with a focus on volatility-based position sizing, drawdown control, and Monte Carlo risk modeling across futures and forex markets.















