Maybe you're trading the wrong timeframe

Most traders default to the toughest trading timeframe.
Not the shortest. Not the longest. The middle. And the middle is where accounts can stagnate, or worse, drop in value.
Trading intraday removes hedge funds, institutions, and professional money managers from the equation — they don't operate at the same timeframe. That's a significant portion of the market not working against you, and it works directly in your favour.
Over very short periods, the market can be wildly distorted - forced liquidations, relative-value transactions and one-sided flow pushing price somewhere it has no business being. Then it corrects.
Those windows are where the cash flow is. At a professional fir,m I watched traders string together profitable session after session, across weeks to months, not because they were lucky, but because at short enough timeframes, the dislocations are that consistent.
Over very long periods, asset prices tend to reflect reality. Own quality long enough, and the tailwind does some of the work.
The middle ground carries neither benefit. It absorbs headline risk and whatever the overnight hours decide to deliver.
The middle timeframe is also the most crowded — too many participants, too many variables, making it the hardest place to build anything consistent. More noise between you and a tradeable signal, more variables working against any repeatable approach.
Intraday removes overnight exposure entirely. What happens between sessions doesn't touch you - geopolitical events, economic data, a complete repricing of the market's view. When you're flat, none of it reaches you. Intraday, those same events are often the catalyst for the best trades of the week.
But each session, the regular-like-clockwork opportunity comes from behaviour that repeats - traders forced to exit positions, activity around session boundaries, price that overreaches before returning to short-term value. It might occur randomly (many times it's not), but the behaviour repeats consistently enough to be tradable using the same repeatable framework and playbook trades.
What you're looking at in that chart below are repeating behaviours, yet it's intel that other traders don't have. The Pre-Pro Low™ — a proprietary calculation of the kind that stays inside professional trading firms — anchors price to the downside before price moves. Once the price reaches the transition at 24,749, no more short trades.
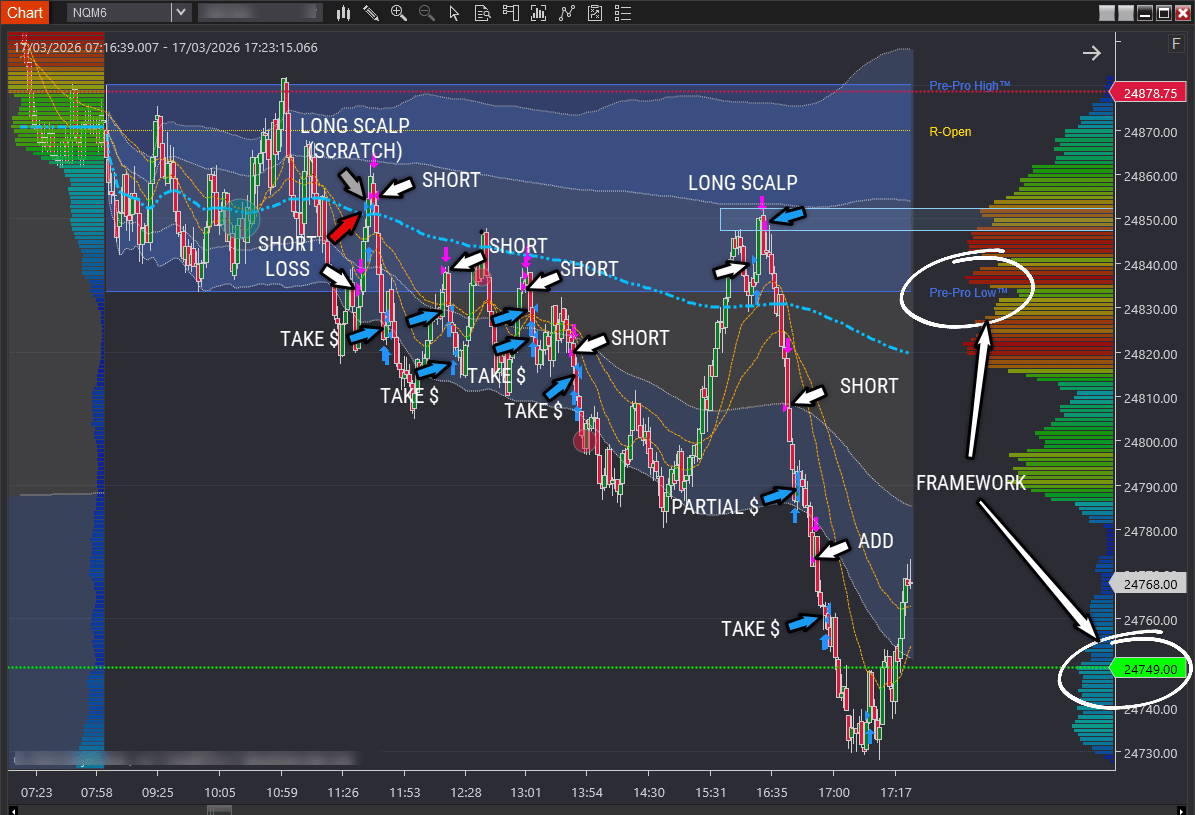
The pre-pro and trade boundary awareness is there before the price does what it does. It's not a prediction - it's a framework that incorporates multiple points of evidence, applied the same way across 1,355+ documented sessions since 2020.
It moves decision-making away from you and onto a process with positive expectancy. That seems flippant, seeing it written, yet positive expectancy is the number one missing ingredient for nearly all who trade.
But even with positive expectancy, I still make mistakes. The loss above was a poor trade that's on me, not on the framework.
A trading framework that only has positive expectancy if it's perfectly executed is not viable. It's pressure you don't need. Even though your goal is perfection, your framework should allow for some mistakes yet retain positive expectancy.
As far as the time spent at the screens, you decide how long your trading business opens its doors each day and whether to extend or reduce that around your life.
One caveat: in the development phase, consistency of application matters more than hours. New cognitive load fatigues quickly, and forcing long sessions produces fatigue-driven decisions, not faster progress.
The biggest misunderstanding about intraday trading is the risk. If you're winging it, oversizing positions, and not sticking to a framework that holds up in live market conditions, then due to trade frequency, you quickly dig holes you can't come back from.
But trade with a repeatable framework and you contain negative variance - that's a control you now have on risk to within your tolerances.
Look at the price scale on the right. Run your eye across the entries and exits - the largest loss was 20 points, and the winners add up to substantially more. Add a zero and double it. That's one contract's dollar result (less commissions).
But look closer - how far did any of those trades go against you before closing? Then consider what happens to that number if you hold it overnight. It can be ten times that amount. Smaller adverse movement means bigger sizing - that's where intraday's real upside sits.
The barriers to intraday trading aren't what most traders think. The only real one is whether you have a repeatable framework to apply.
Most traders are in the middle timeframe by default - not by design, and not because it offers the most opportunity, but because that's where everyone else is. The most crowded, most difficult timeframe to build anything durable in, and it's where the majority plant their flag without ever asking whether conditions are better elsewhere.
It is. The dislocations are more frequent and more repeatable at shorter timeframes when you know what to look for. Someone is taking that money - it isn't the trader holding through the noise.
You can't have consistent, low-variance cash flow from trading without trading intraday. It isn't available any other way.
That's a trading business built on a playbook of income-producing assets — the same trades, the same framework, session after session. The misconceptions about risk and time commitment are what have kept most traders from operating where the skew is in their favour.
The skew in your trading's favour is intraday.
Author

Adam Fiske
Boss Trading
Adam is an industry-trained trader with 19 years of professional trading experience.


