How to find the end of a corrective wave using volume profile [Video]
![How to find the end of a corrective wave using volume profile [Video]](https://editorial.fxsstatic.com/images/i/EURUSD-neutral-object.png)
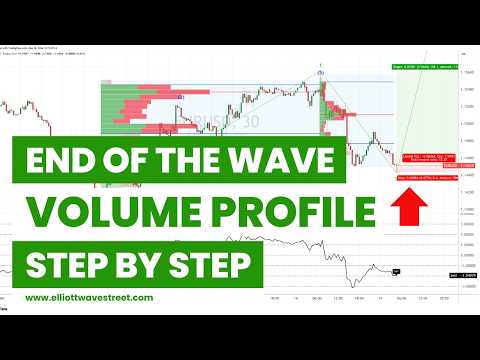
Five waves up. The impulse completes. And then the real trader's problem begins: the retracement. Where does Wave 2 end? When can you enter Wave 3 without getting trapped in a continued decline? Most answers circulating about this come down to Fibonacci — the 50% retracement, the 61.8%, the 78.6%. And while Fibonacci helps, it doesn't answer the most important question: does volume confirm the retracement is exhausted?
In this breakdown, I show you how we combine Volume Profile, Elliott Wave, and the Volwaves indicator to find the end of a corrective wave with surgical precision.
What the video shows: 70% of the volume was at the highs
The starting point is always the completed impulse. Five bullish waves. Once identified, the first thing we do is overlay Volume Profile across the entire impulse. And here the first critical clue appears: approximately 70% of the cycle's volume concentrates at the upper price range.
That tells the Market Maker something very specific. The late buyers — the ones who entered near the top, motivated by news or by the FOMO of watching price rise — are all concentrated in a narrow band. And they all share one thing in common: stops below, at predictable levels.
The Market Maker cannot continue the next bullish impulse while those stops are still there. He needs to clear the band first. That's why the retracement isn't a "correction" in the passive sense — it's a deliberate liquidity-hunting operation.
As price drops during Wave 2, the Volume Profile of the retracement (measured from the high of Wave 1 to the current low) shows that volume is drying up. Less participation. The buyers have already closed their positions involuntarily, and new sellers are diminishing. That's what we technically call "supply drying up" — and it's the first signal that the retracement is approaching its end.
What the video didn't cover: When to extend the profile and when not to
Here's the technical detail that separates a trader who understands Volume Profile from one who only uses it visually.
The Volume Profile should only be extended when price makes a new low. Not before, not after. That's the rule.
If price bounces from an intermediate support without making a new low, the profile doesn't move. You continue evaluating with the data you had. If price breaks the previous low, then you update the profile and observe what happened to the volume distribution. If the point of control (the level with the highest volume) is still above — meaning it didn't shift to the new low — that confirms volume is drying up. We're near the end.
For the technical reader: A point of control that doesn't shift with a new low is a signal of divergence between price and volume — analogous to an RSI or MACD divergence, but measured in terms of actual market participation. When that divergence coincides with Volwaves in the negative 2 zone (high probability of return to fair value) and Elliott Wave indicating the end of a corrective wave, the confluence is so high that trade risk can be defined in just a few pips.
The two-entry structure
The video shows two entries, not one. This matters because it reflects how an institutional position is actually built, not as "one magic shot."
First entry — at the initial reversal candle
When the first green reversal candle appears after a significant retracement, with a tight stop just below the swing low (around 20 pips of risk). This is an exploratory entry. Smaller in relative size. The purpose isn't to capture the entire move — it's to be positioned in case price turns immediately.
If the trade progresses, we move the stop to break even when there's 1:1 gain. From that point on, the risk on that first position is zero.
Second entry — after the new low and Volwaves confirmation
When price makes a new low and, by extending the Volume Profile, we see the point of control is still above (volume drying up), plus Volwaves entering the negative 2 zone, plus Elliott Wave confirming the end of Wave 2 — that's where the second position enters. Larger. With greater structural confidence.
This turns the trade into a well-constructed pyramid: first entry protecting capital, second entry capitalizing on maximum confluence.
The target and when to exit
The first target is always the point of control of the complete Volume Profile — that zone where 70% of the impulse's volume concentrated. It's the institutional "fair value" level. When price returns there, what we're seeing is the market finding its equilibrium value.
The second target, if Wave 3 confirms, is the previous high. But here a critical management rule enters: when Volwaves enters the positive 2 zone, the cycle is completing. Tighten the stop loss or reduce position. Staying in waiting for "a little more" after positive 2 is where most traders give back their gains.
Why this approach works in any market
The technique works in forex, futures, equities, and even cryptocurrencies. The only difference is the source of the volume: in forex we use tick volume because the market is over-the-counter (not centralized), while in futures or equities we have real transaction volume. Tick volume has approximately 80% correlation with real volume, which is sufficient to identify the concentration zones we need.
The principle is universal: where volume concentrates, there is liquidity. Where there is liquidity, there are stops. And where there are stops, there is institutional movement. Volume Profile simply shows you that map.
What to watch after Wave 2
When Wave 3 completes and Wave 4 begins, the entire process repeats. Volume Profile over Wave 3, identify where volume concentrated, wait for the retracement, evaluate whether volume is drying up, find the entry in Wave 5.
If at any point the Volume Profile behavior doesn't confirm — if the point of control shifts with the new low, for example — that's a signal that the structure may be a complex pattern or an extended correction. In that case, better to stay out. Managing when not to trade is as important as managing when to enter.
Author

Juan Maldonado
Elliott Wave Street
Juan Maldonado has a University degree in Finance, and Foreign trade started his trading career in 2008. Since 2010 has been analyzing the markets using Elliott Wave with different strategies to spot high probability trades.