After the release of economic data do you hold the position or square up?

You've got to Know when to hold em', Know when to fold'em
I've had a load of questions of late associated with trading economic data releases. This is a tricky situation and your success will definitely improve with more experience on trading the economic data.
Kenny Rogers was right on the money when he came up with this nifty tune:
You've got to know when to hold 'em, know when to fold 'em,
Know when to walk away, know when to run.
You never count your money when you're sittin' at the table,
There'll be time enough for countin' when the tradin's done.
Apparently Kenny loves trading the Euro!
But on a serious note this phrase is very true for trading the economic data releases.
Now back to the questions I've been getting:
Question: How do you know when to stay in the position or close it out when we get big variance in the data?
Answer: To me, it comes down to price action.
This is one of the few periods of the day where I will focus in on the price action and I will make my decision to stay in the position or square it up in the first 30 seconds to 1 minute after the release.
Now this isn't an exact science as any two numbers could have similar results and yet get a completely different reaction. That's because the resulting move not only depends on the level of variance but also other factors currently impacting the market, like subtle geopolitical issues and technical levels.
For example take the US GDP data that was released on Friday 27th October.
Forecast 2.5% - Actual 3.0%: this is a huge number and should favour a strong move in the USD.
Result: The USD dip rally briefly and then stalled. It basically just stayed still.
How did I play it? I was short EURUSD, AUDUSD, GBPUSD, NZDUSD and long USDJPY on the release.
The initial reaction was 20 pips in favour of the USD and all positions were active. But then something weird happened. The currencies retraced to their original levels prior to the release and then stalled. The retracement wasn't the weird thing, it was the fact that the USD didn't have a counter move.
This happened within the first 30 seconds and if you really want to be sure, wait a full minute. You'll have your answer by then.
The moved stalled and I closed out all positions immediately with about a 3-5 pip profit.
The price action tells a story in this situation and is a great 'indicator' if the move is going to be big or nothing at all.
After all there's no point leaving unnecessary risk on the table especially on a Friday.
Why didn't the USD rally further?
It's hard to know what's holding the USD back at the time of the release and that's why I focus on price action more than anything else. But after the event we usually get the answers.
Technically in the case of the EURUSD the pair had already fallen over 200 pip after the ECB meeting on Thursday, so it was stretched to say the least.
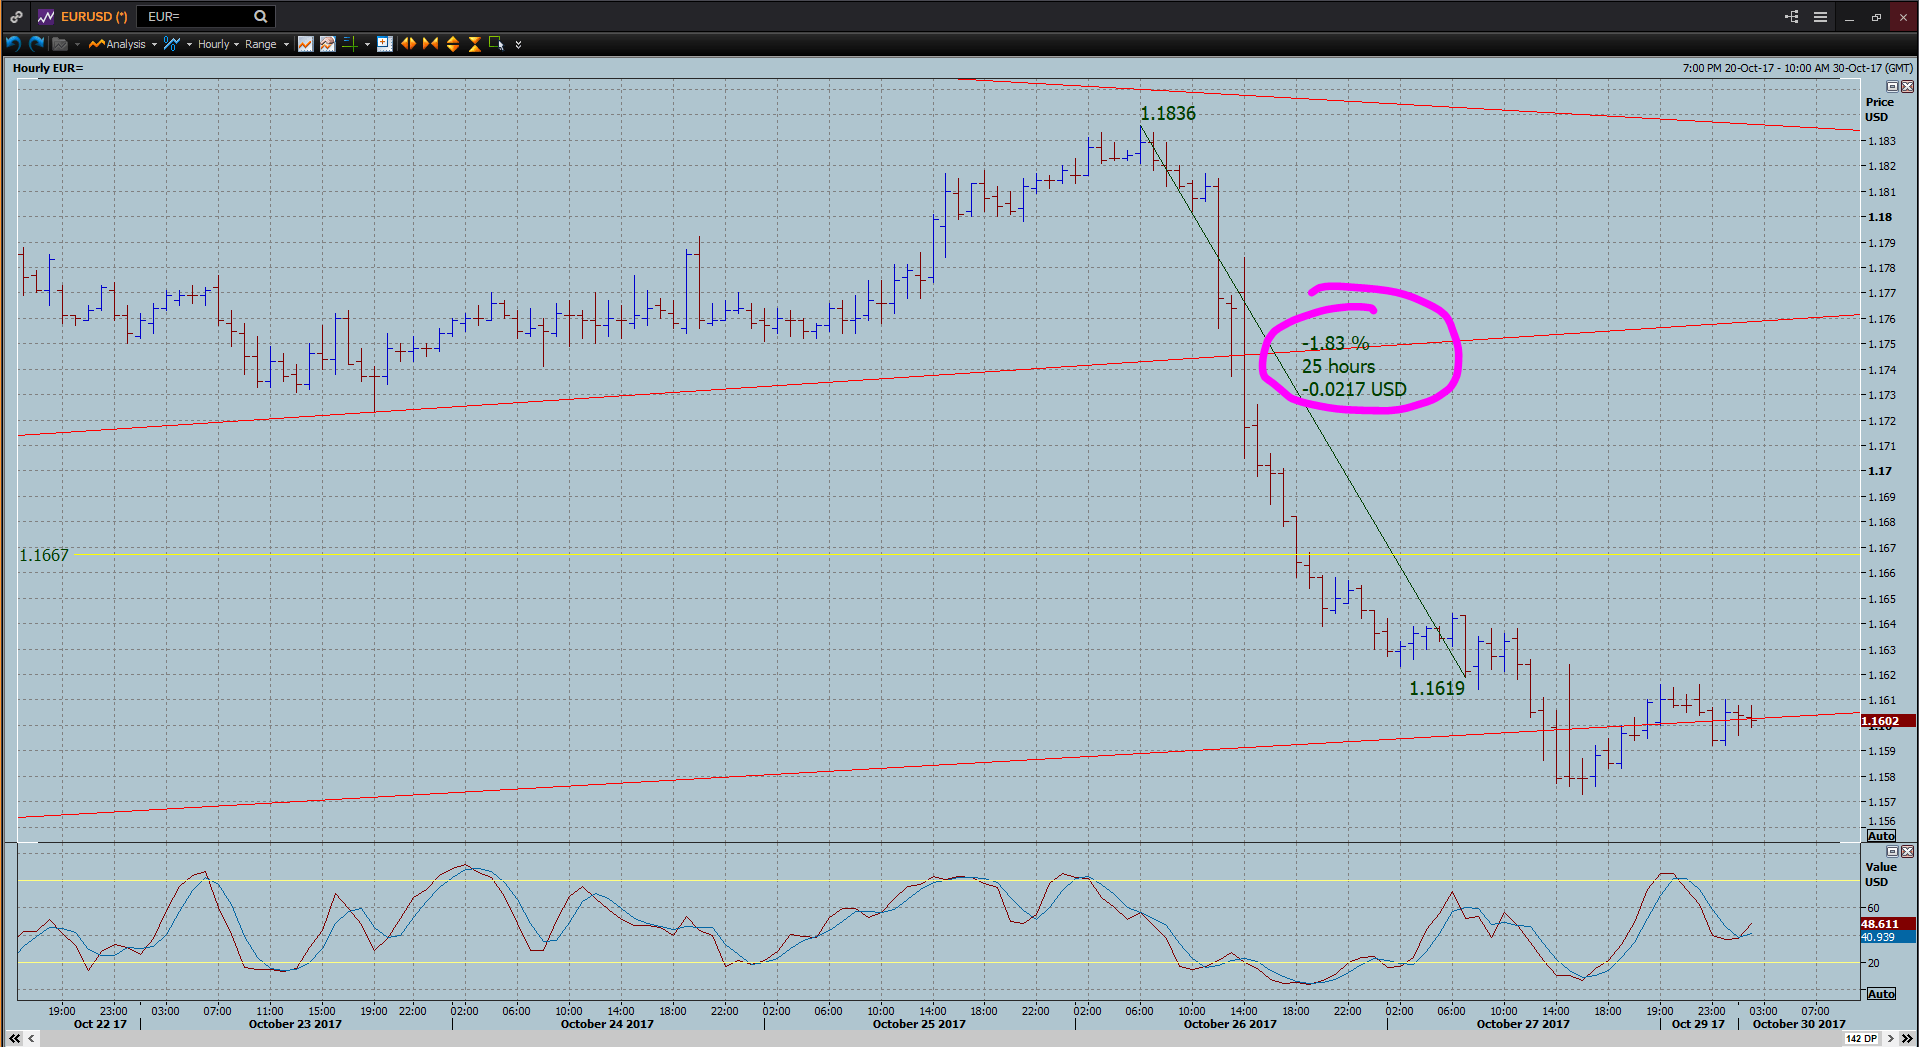
Plus the currency pair started dancing up and down through the support trendline around 1.1600. So the significance of that technical level was lost. Traders appeared reluctant to push it further.
But the main reason why the USD didn't go had more to do with Trump's "toing and froing"on his decision as to who was going to be the next Head of the US Federal Reserve. That's right another crap geopolitical issue.
At the time of the release you have to realise that you may not have all the information in front of you. So focusing on the price action is the best option.
Otherwise you'd be inclined to see the data, buy USD and just sit on the position, leaving unnecessary risk on the table.
Now this may be a good thing to do sometimes but other times you'll get caught up in the 'no-move' and get stopped out.
Don't forget we are trading the economic data looking for an immediate reaction or move. If we don't get the move, then square up!
As I mentioned earlier this isn't an exact science but what you're trying to do is isolate the best trading opportunities.
If we don't get the right price action then perhaps the trade isn't right.
Don't second guess yourself. Know what you're looking for and then trade it.
What would be the correct price action to hold the position in this US GDP example?
The first thing to realise is the variance in the GDP data was high. That means we should see a bigger, stronger move in the USD.
So I would expect the USD to rally 20-25 pips immediately, retrace back about 10-15 pips and then continue to rally.
The fact it stalled so quickly after the release (which was big variance) was a major concern and led to the decision to square up the positions.
Why is this important?
There's a lot of cash in the data releases. Sometimes they are great opportunities and other times they are a nightmare.
Being able to identify which ones are which is very important, otherwise you could be walking into a mine field!
But just as important is being able to 'read the market' & in this instance the price action after the releases.
You'll only get this level of judgement by watching and trading the data releases.
Once you have it worked out you can continue to give yourself the opportunity to make cash out of the economic data releases.
The process for trading economic data is:
-
Get yourself into the trade
-
Assess price action immediately
-
Make your decision: hold'em or fold'em!
You get this right and it will also take away a lot of the fear & risk associated with trading the economic data releases.
Brad
Author

Bradley Gilbert
Traders4Traders
With over 20 years trading experience throughout every major financial centre, Traders4Traders was founded by an experienced, well respected trader in the industry.


