The win rate vs risk-reward debate has a different answer on funded accounts


Ask any trading forum whether a high win rate or a strong risk-reward ratio matters more, and you will get the textbook answer: expectancy is what counts, and a 40% win rate with 3-to-1 winners beats a 65% win rate with 1-to-1 payoffs. Over a long enough horizon, that answer is often correct.
On a funded account, it is frequently wrong. The reason has nothing to do with market conditions. It has to do with the rules.
The consistency cap inverts the ranking
Most funding programs apply some form of consistency rule during the evaluation or the funded stage: no single day may exceed 30% to 50% of total profit. The rule is usually described as a discipline check. Mechanically, it is nothing of the sort. It is a constraint on the distribution of daily results.
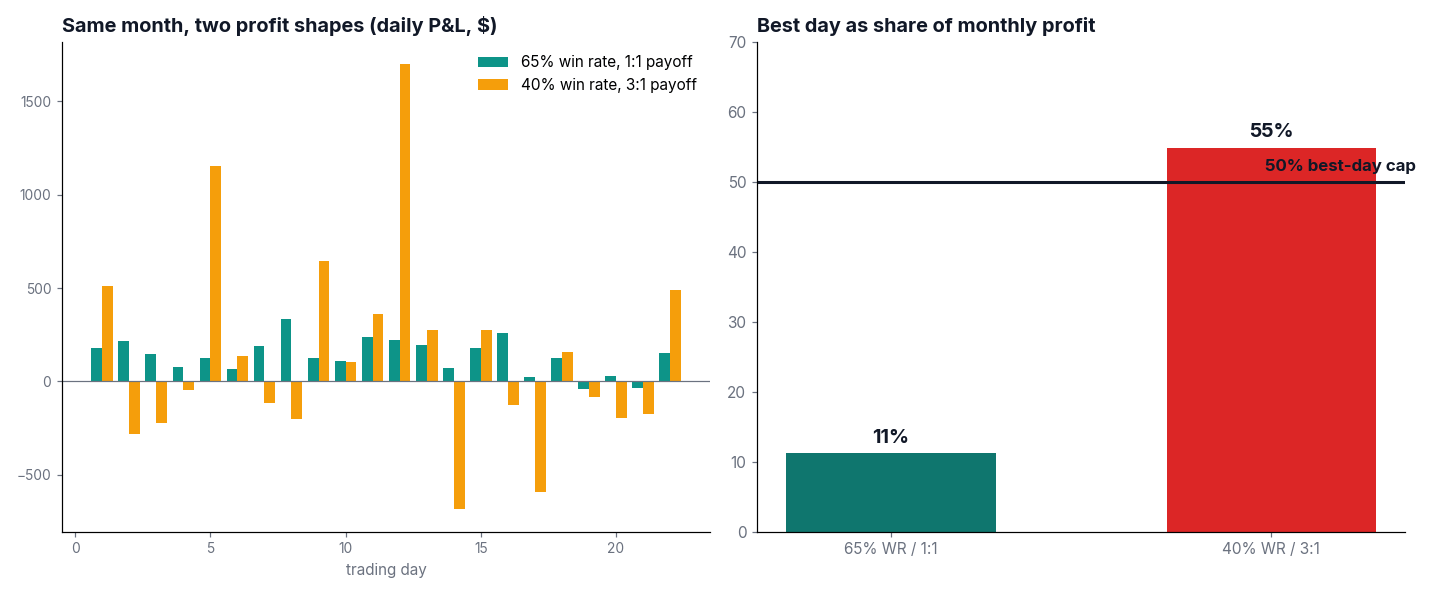
Run the arithmetic on a hypothetical $50,000 account with a $3,000 profit target and a 50% best-day cap. A trader with a 65% win rate and roughly 1-to-1 payoffs accumulates the target through many small days: $150 here, $240 there. No single day comes close to half the total. The cap is invisible to this profile.
Now take the textbook favorite: 40% win rate, 3-to-1 winners. Simulate 200 trades with those parameters and the profit does not arrive smoothly, it clusters. A handful of strong sessions carry the month, which is precisely the behavior the expectancy math celebrates. One $1,700 day against a $3,100 running total is 55%. Evaluation failed, while profitable. The strategy did not misbehave; its shape simply violates the constraint by construction.
The asymmetric profile is not slightly disadvantaged here. Depending on how concentrated its winners are, it can be structurally unable to pass certain rule sets, at any level of profitability.
Trailing drawdown compounds the effect
The second common rule, trailing drawdown, follows the account's peak equity. In its intraday form, the floor moves with unrealized profit. A gold position that runs $18 in the trader's favor and closes $4 higher has lifted the floor by the full $18. The closed result looks fine; the buffer is quietly smaller.
This punishes exactly the trade management style that large-winner strategies require: letting positions breathe, tolerating giveback, holding for the outsized exit. The effective unit of risk on such accounts is not the stop distance. It is the stop plus the open profit the strategy typically returns before closing. High win-rate, quick-exit profiles barely register this rule. Asymmetric profiles bleed buffer through winning trades.
Stack both rules, a consistency cap plus intraday trailing, and the textbook-superior strategy fails the same rule set through two independent mechanisms, while the textbook-inferior one passes both without adjustment.
Why this hits Gold and index CFD traders hardest
The effect is not evenly distributed across instruments. Strategies built on XAU/USD and index products tend to be the asymmetric kind, because that is where the payoff lives: wide ranges, fast expansions, and the occasional session that produces a month's profit in four hours.
That is the profile a consistency cap is least tolerant of. A trader running the same logic on a major currency pair, with smaller ranges and more frequent modest winners, will often pass the identical rule set without ever noticing it was there. Same discipline, same execution quality, different distribution.
What to do with this
None of this means high win-rate trading is better. Outside the rule set, over a long horizon, expectancy still governs. It means that "which approach is better" and "which approach passes" are different questions, and only the second one is being graded during an evaluation.
The practical procedure is straightforward. Take the last twelve months of your real daily results. Compute what share of each month's profit came from its single best day, and compare that against the cap in the specific program you are considering. Then estimate your typical open-profit giveback per trade and treat stop-plus-giveback as your true risk unit against the trailing floor. If the first number regularly exceeds the cap, you are not looking at a discipline problem. You are looking at a mismatch between the shape of your returns and the shape the program rewards, and the fix is either a different rule set or a deliberate change to how profit is distributed across days.
What this does not fix
Matching shape to rules will not rescue a strategy without an edge, and it will not eliminate variance. A well-matched profile can still land in an unlucky sequence and fail. It also says nothing about which style earns more once funded; several programs relax consistency constraints after the evaluation, at which point the textbook math regains its authority.
The claim here is narrower. During the evaluation, the rule set is the grader, and it grades shape.
The uncomfortable summary: most "profitable but failed" stories are not discipline failures. They are shape mismatches that were readable in the trade log before the entry fee was ever paid.
Author
















