XRP price down nearly 30% in 2026 as chart flashes $1 warning


XRP traded 64% below its multi-year peak of $3.66 on Thursday, as more signs of a potential deeper correction toward $1 emerged.
Key takeaways
- XRP faces stiff resistance above $1.40, where more than 1.1 billion tokens were previously acquired.
- Declining daily active addresses signal reduced transaction activity and cooling network demand for XRP.
- Muted spot ETF inflows point to reduced institutional demand.
Symmetrical triangle targets $1 XRP price
Data from TradingView shows XRP trading below a key resistance zone on the daily chart, as shown below.
This is the $1.40-$1.45 supply zone, where the upper trend line of a symmetrical triangle, the 200-week exponential moving average (EMA,) and the 50-day EMA converge.
The cost-basis distribution heatmap shows that investors acquired over 1.1 billion XRP within this price range.
Any attempts to push XRP price above this level could be met by aggressive selling from these investors, who may be seeking to break even.

The price is now retesting the lower boundary of a symmetrical triangle at $1.30.
A break below this level would confirm the continuation of the downtrend, first toward the 200-week SMA around $1.14, and later to the measured target of the triangle at $1.
“If XRP loses its current support, data highlights downside targets near $1.146 and $0.884,” analysts at CryptoBasic said on Wednesday post on X, adding:
The broader bullish structure remains valid only if XRP holds above the critical $0.93 level, which acts as the main invalidation point.

As Cointelegraph reported, the $1.27 level is a must-hold for the bulls in the short term to avoid further losses.
XRP network activity declines
Onchain data, meanwhile, shows that the XRP Ledger has experienced a significant drop in network activity since July 2025.
Data from Glassnode reveals that the daily active addresses (DAAs) on the network are now far below the numbers seen in March and June 2025, and remain muted around 50,000.
With only around 48,000 daily active addresses at the time of writing, user transactions have decreased, possibly signaling reduced interest or a lack of confidence in XRP’s near-term outlook.
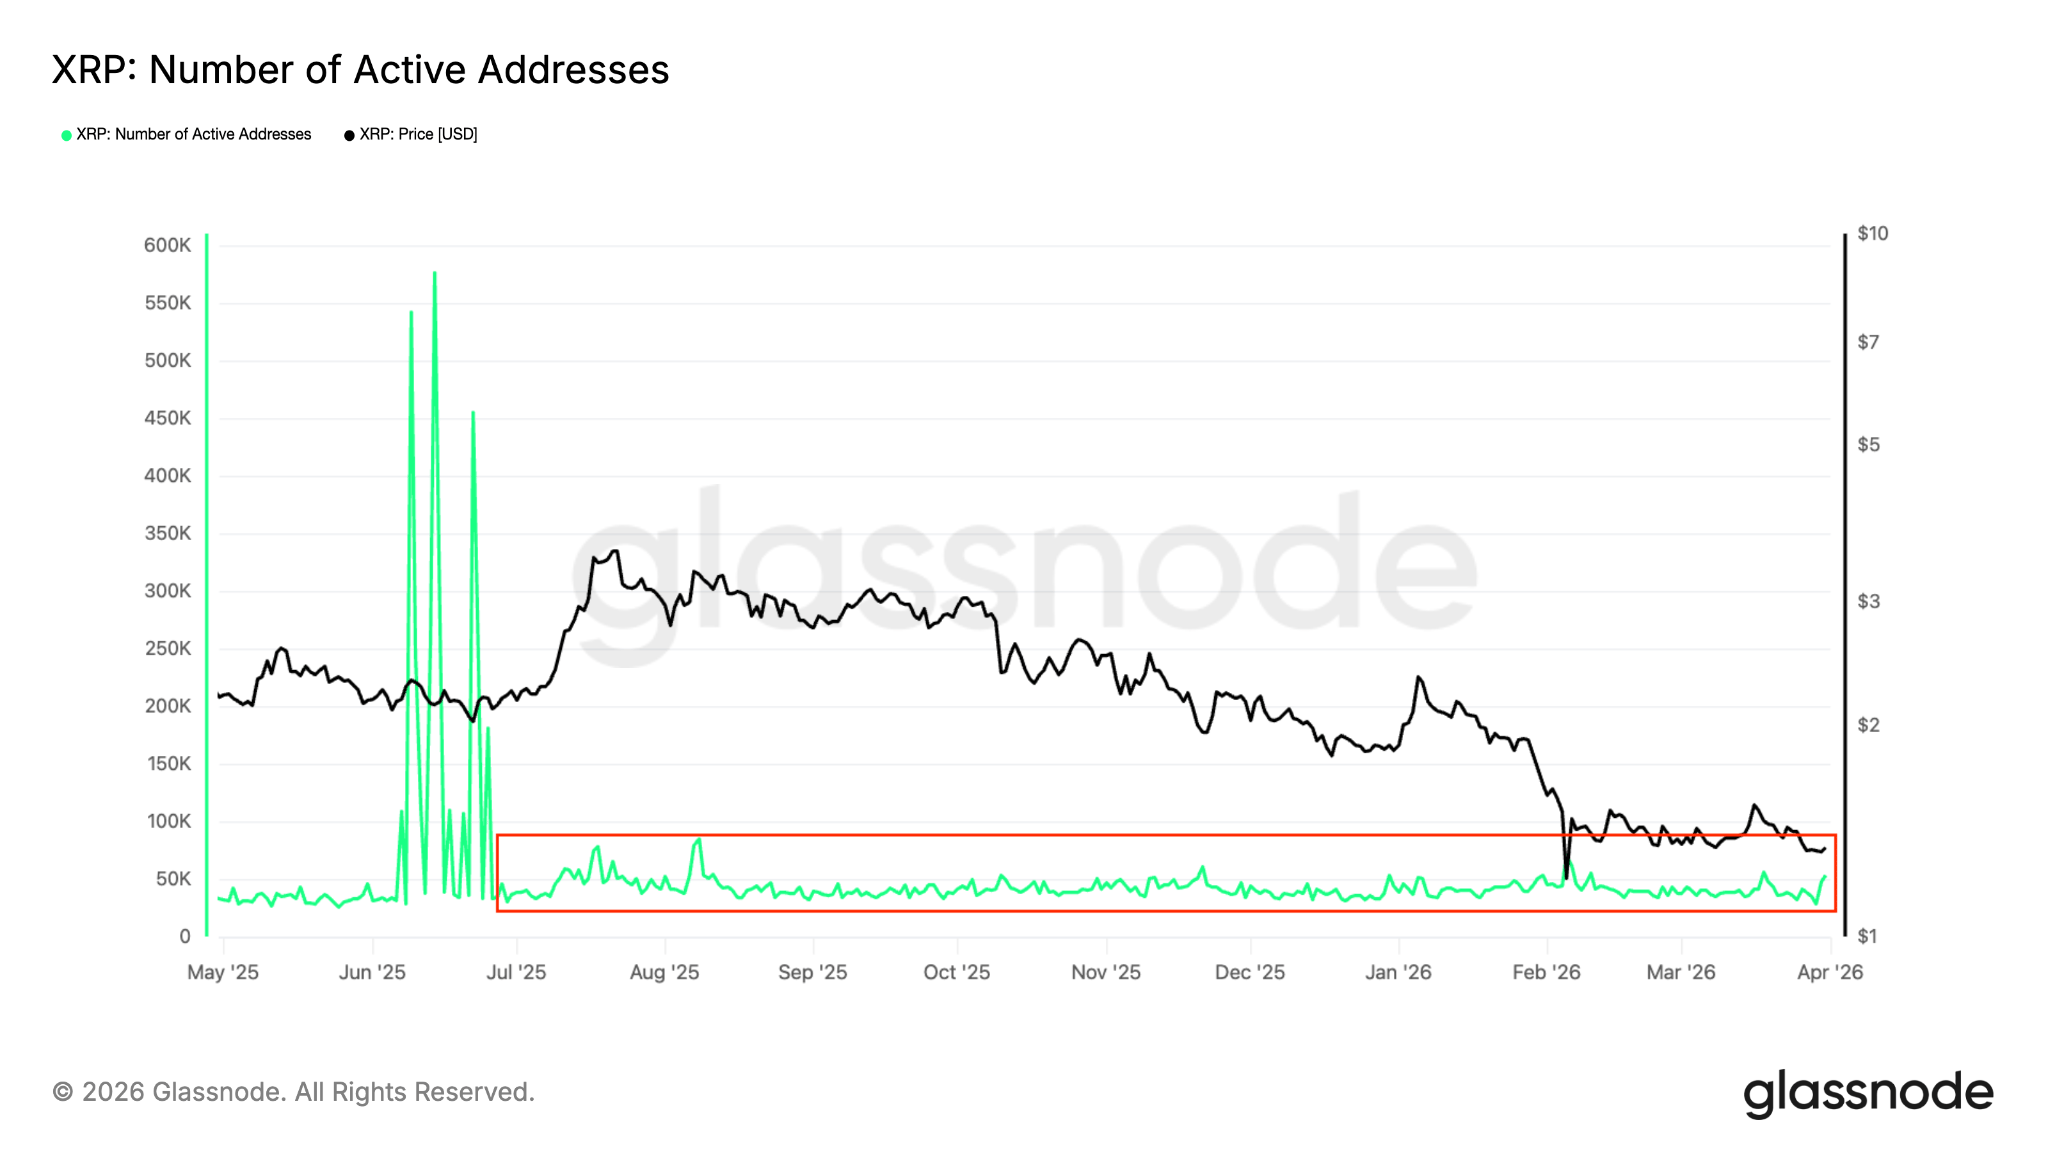
Historically, declines in network activity typically accompany price stagnation as lower transaction volume means less liquidity and fewer buyers.
The number of daily transactions has also dropped sharply by 44% to 1.5 million on Wednesday from 3.4 million on March 21, per data from CryptoQuant.

Additionally, US-based spot XRP exchange-traded funds (ETFs) flows warn of fading institutional demand, with March marking the first negative month since launch.
Spot XRP ETFs are having it “tough,” recording zero inflows since March 26 as the “price declines and demand weakens,” Analyst WizzyOnChain said in a recent post on X, adding:
In March, they have accumulated net outflows of $28 million, marking their first negative month since their launch.

Total assets under management peaked around $1.24 billion in early January but have dropped to roughly $947 million today, dragged down by XRP's price decline of over 28% in the first quarter of 2026.
Author
Cointelegraph Team
Cointelegraph
We are privileged enough to work with the best and brightest in Bitcoin.