XRP and XLM outlook: Price action remains under pressure as downside pressure intensifies
- Ripple extends losses after closing below the key 50-day EMA level at $1.41, earlier this week.
- Stellar continues to weaken on Thursday, after printing three consecutive red candlesticks.
- Momentum indicators for both altcoins remain bearish, while derivatives data shows traders maintaining strong short positions.

Ripple (XRP) and Stellar (XLM) price action remains under pressure so far this week, with XRP and XLM extending their recent losses by over 4% and 6%, respectively. Both altcoins have slipped below key support levels, with momentum indicators turning negative and short positions remaining robust, hinting at further downside ahead.
Short bets remain robust among traders
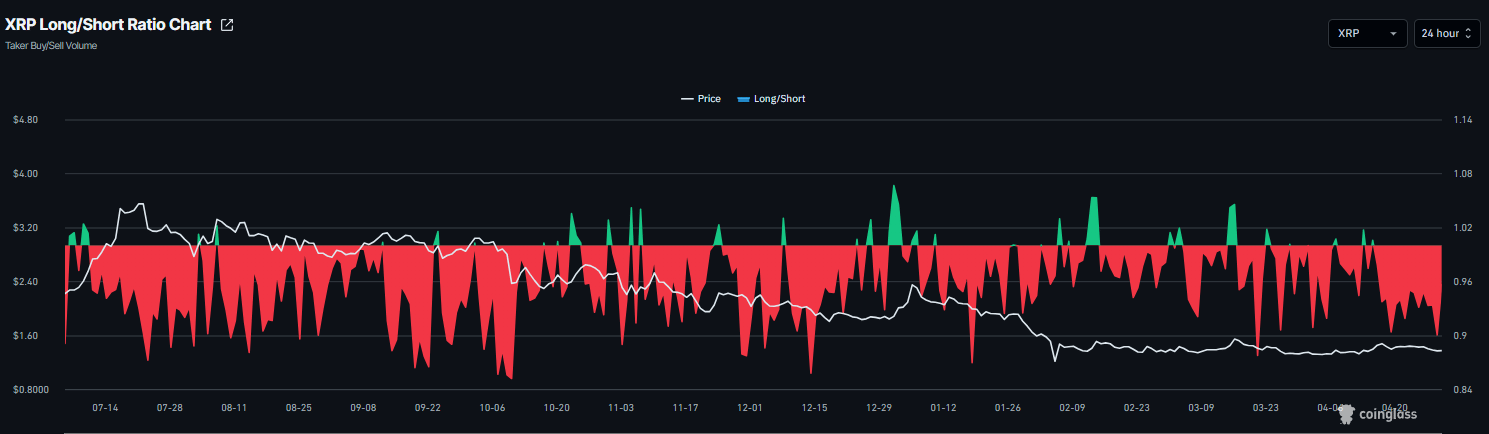
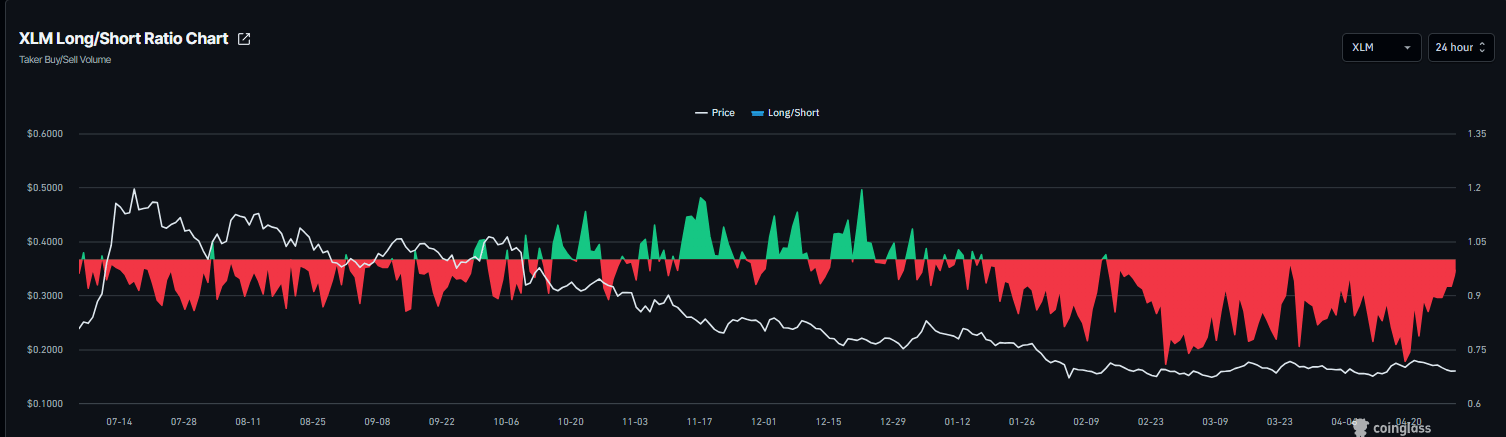
Ripple and Stellar traders’ short bets continue to remain strong. CoinGlass’ long-to-short ratio for XRP and XLM reads 0.95 and 0.96, respectively, on Thursday and has mostly remained in the red territory since early April. This ratio, being below one, reflects bearish sentiment in the market, as more traders are betting on the asset’s price to fall.
XRP technical outlook: Momentum continues to weaken
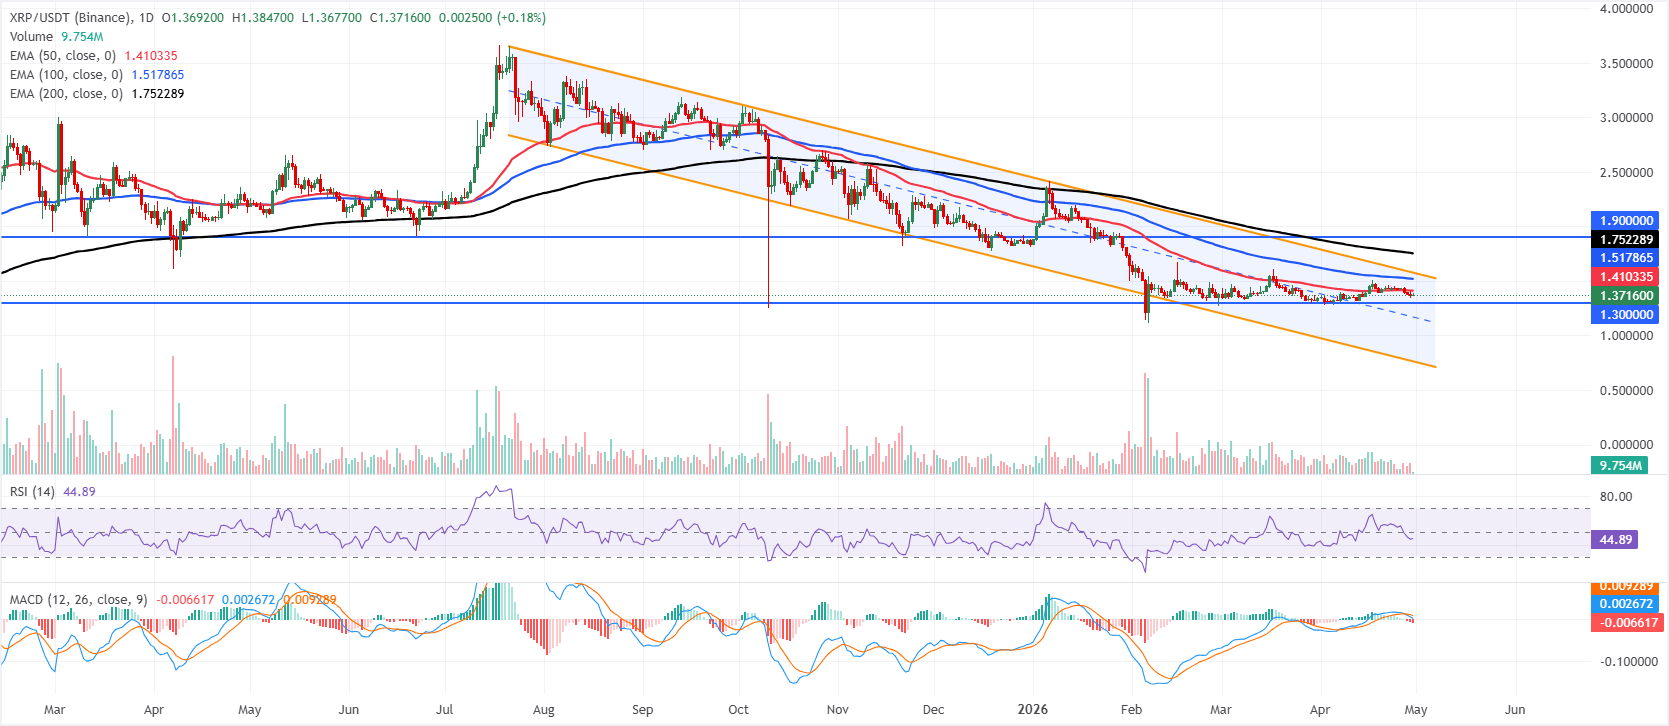
XRP is trading at $1.37 on Thursday, maintaining a bearish bias as it holds within a downward parallel channel and remains beneath the key Exponential Moving Averages (EMAs). The 50-day EMA at $1.41, the 100-day EMA at $1.51 and the 200-day EMA at $1.75 all sit overhead, suggesting rallies remain corrective within a broader decline.
The Relative Strength Index (RSI) on the daily chart is around 45, and a negative Moving Average Convergence Divergence (MACD) line reinforces soft momentum, hinting that sellers still retain the upper hand while the pair trades under these clustered EMAs.
On the topside, immediate resistance emerges at the 50-day EMA near $1.41, with further hurdles at the 100-day EMA around $1.51 and the channel’s upper boundary near $1.57. Above there, the 200-day EMA at $1.75 and the horizontal barrier near $1.90 form a broader supply zone.
On the downside, initial support is seen at the horizontal level around $1.30, ahead of the channel floor near $0.76, where buyers would be expected to show more interest if the current pullback deepens.
Stellar technical outlook: Prints three consecutive days of losses
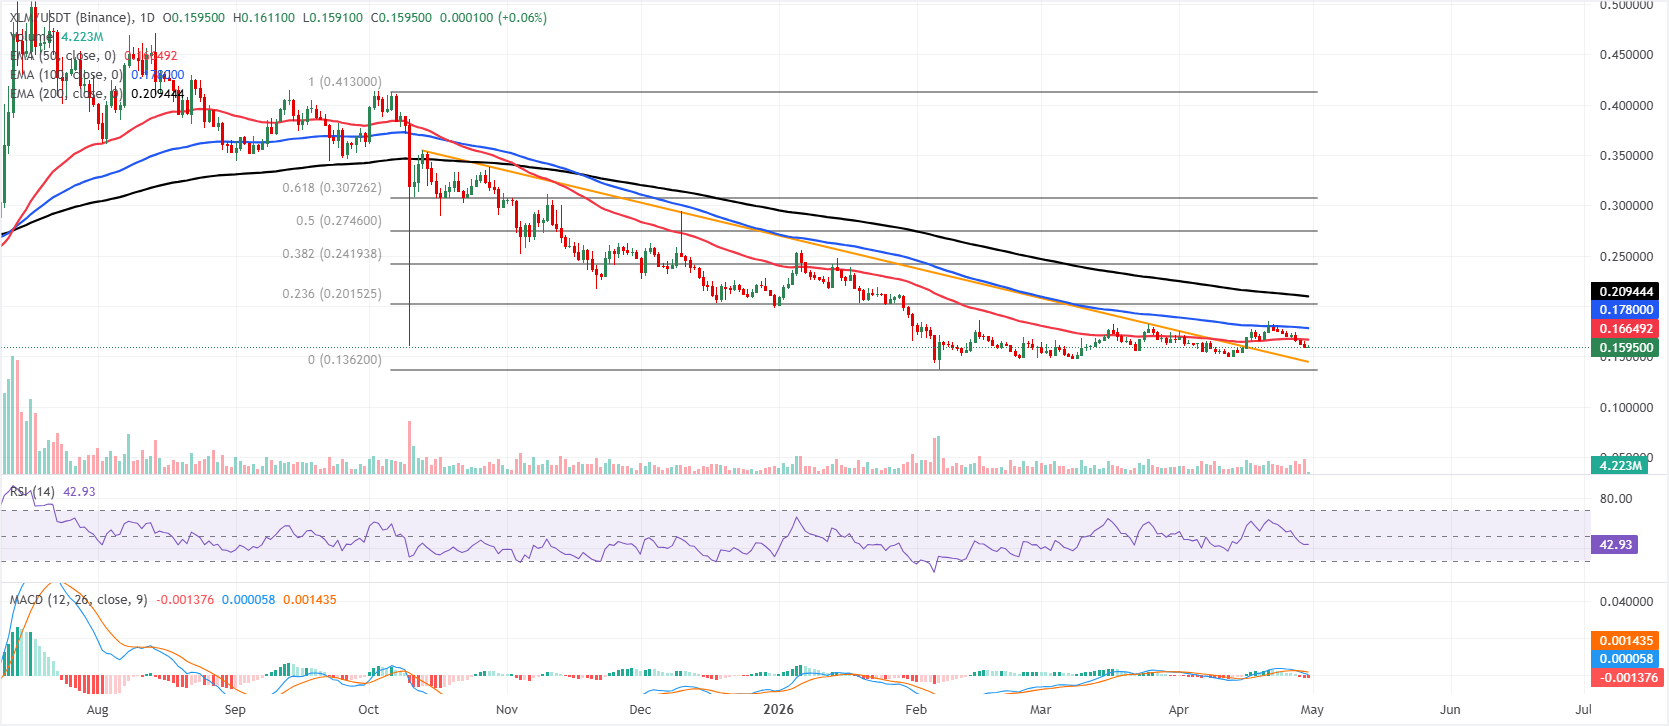
Stellar is trading at $0.159, keeping a bearish near-term tone as it holds below the 50-day, 100-day, and 200-day EMAs, which are clustered overhead from roughly $0.166 to $0.209. The RSI on the daily chart sits around 43, hinting at lingering downside pressure without reaching oversold conditions, while the MACD has slipped further into negative territory, reinforcing the idea that bounces are likely to be capped by these EMAs rather than ushering in a sustained recovery.
On the topside, initial resistance emerges at the 50-day EMA around $0.166, with the 100-day EMA at $0.178 and the 23.6% Fibonacci retracement near $0.201 forming a wider supply band ahead of the 200-period EMA at $0.209.
On the downside, immediate support is seen near the prior descending trendline break at $0.144, ahead of the broader structural floor at the Fibonacci anchor near $0.136, where buyers may attempt to slow the decline if selling pressure resumes.
(The technical analysis of this story was written with the help of an AI tool.)
Author

Manish Chhetri
FXStreet
Manish Chhetri is a crypto specialist with over four years of experience in the cryptocurrency industry.



