Top Altcoins Price Forecast: Ripple eases to $1.40, Solana hits $100, DOGE capped below $0.10
- Ripple drops to $1.40 on Thursday, extending its fourth consecutive day of losses.
- Solana trades around $100, sustaining its bullish momentum in the near term.
- Dogecoin extends mild correction amid profit-taking after last week’s 35% rally.
Ripple (XRP) and Dogecoin (DOGE) are facing downside pressure after double-digit gains last week, while Solana (SOL) extends its rally to $100. The technical outlook for XRP, SOL, and DOGE points to potential upside as the broader market sustains a risk-on sentiment.
Ripple slides down to $1.40
Ripple trades around $1.4033 on Thursday, maintaining a bullish near-term bias as price holds above both the 50-day Exponential Moving Average (EMA) at $1.1733 and the 200-day EMA at $1.3503.
Momentum stays elevated with the Relative Strength Index (RSI) at 69 on the daily chart, easing from extreme overbought levels but still hovering well above neutral. At the same time, the Moving Average Convergence Divergence (MACD) average lines are consolidating, with the histogram starting to contract, hinting at a maturing but still constructive advance.
On the topside, the next significant resistance is seen near the November 21 low at $1.8209, where fresh supply could emerge if the current rally extends.
Looking down, immediate support is at the current price level around the 200-day EMA at $1.3503, with the 50-day EMA at $1.1733 reinforcing the broader bullish structure.
Solana hits $100 amid rising upside momentum
Solana trades at $100.97 on Thursday, following a 5% surge the previous day. SOL extends a strong bullish phase after reclaiming the 50-day and 200-day EMAs at $81.59 and $89.43 as underlying support.
The RSI near 79 signals overbought conditions, while the MACD and signal lines rise steadily in positive territory, indicating a mature bullish impulse.
The next notable resistance for SOL is the December 18 low at $116.88, followed by the $150.00 psychological threshold.
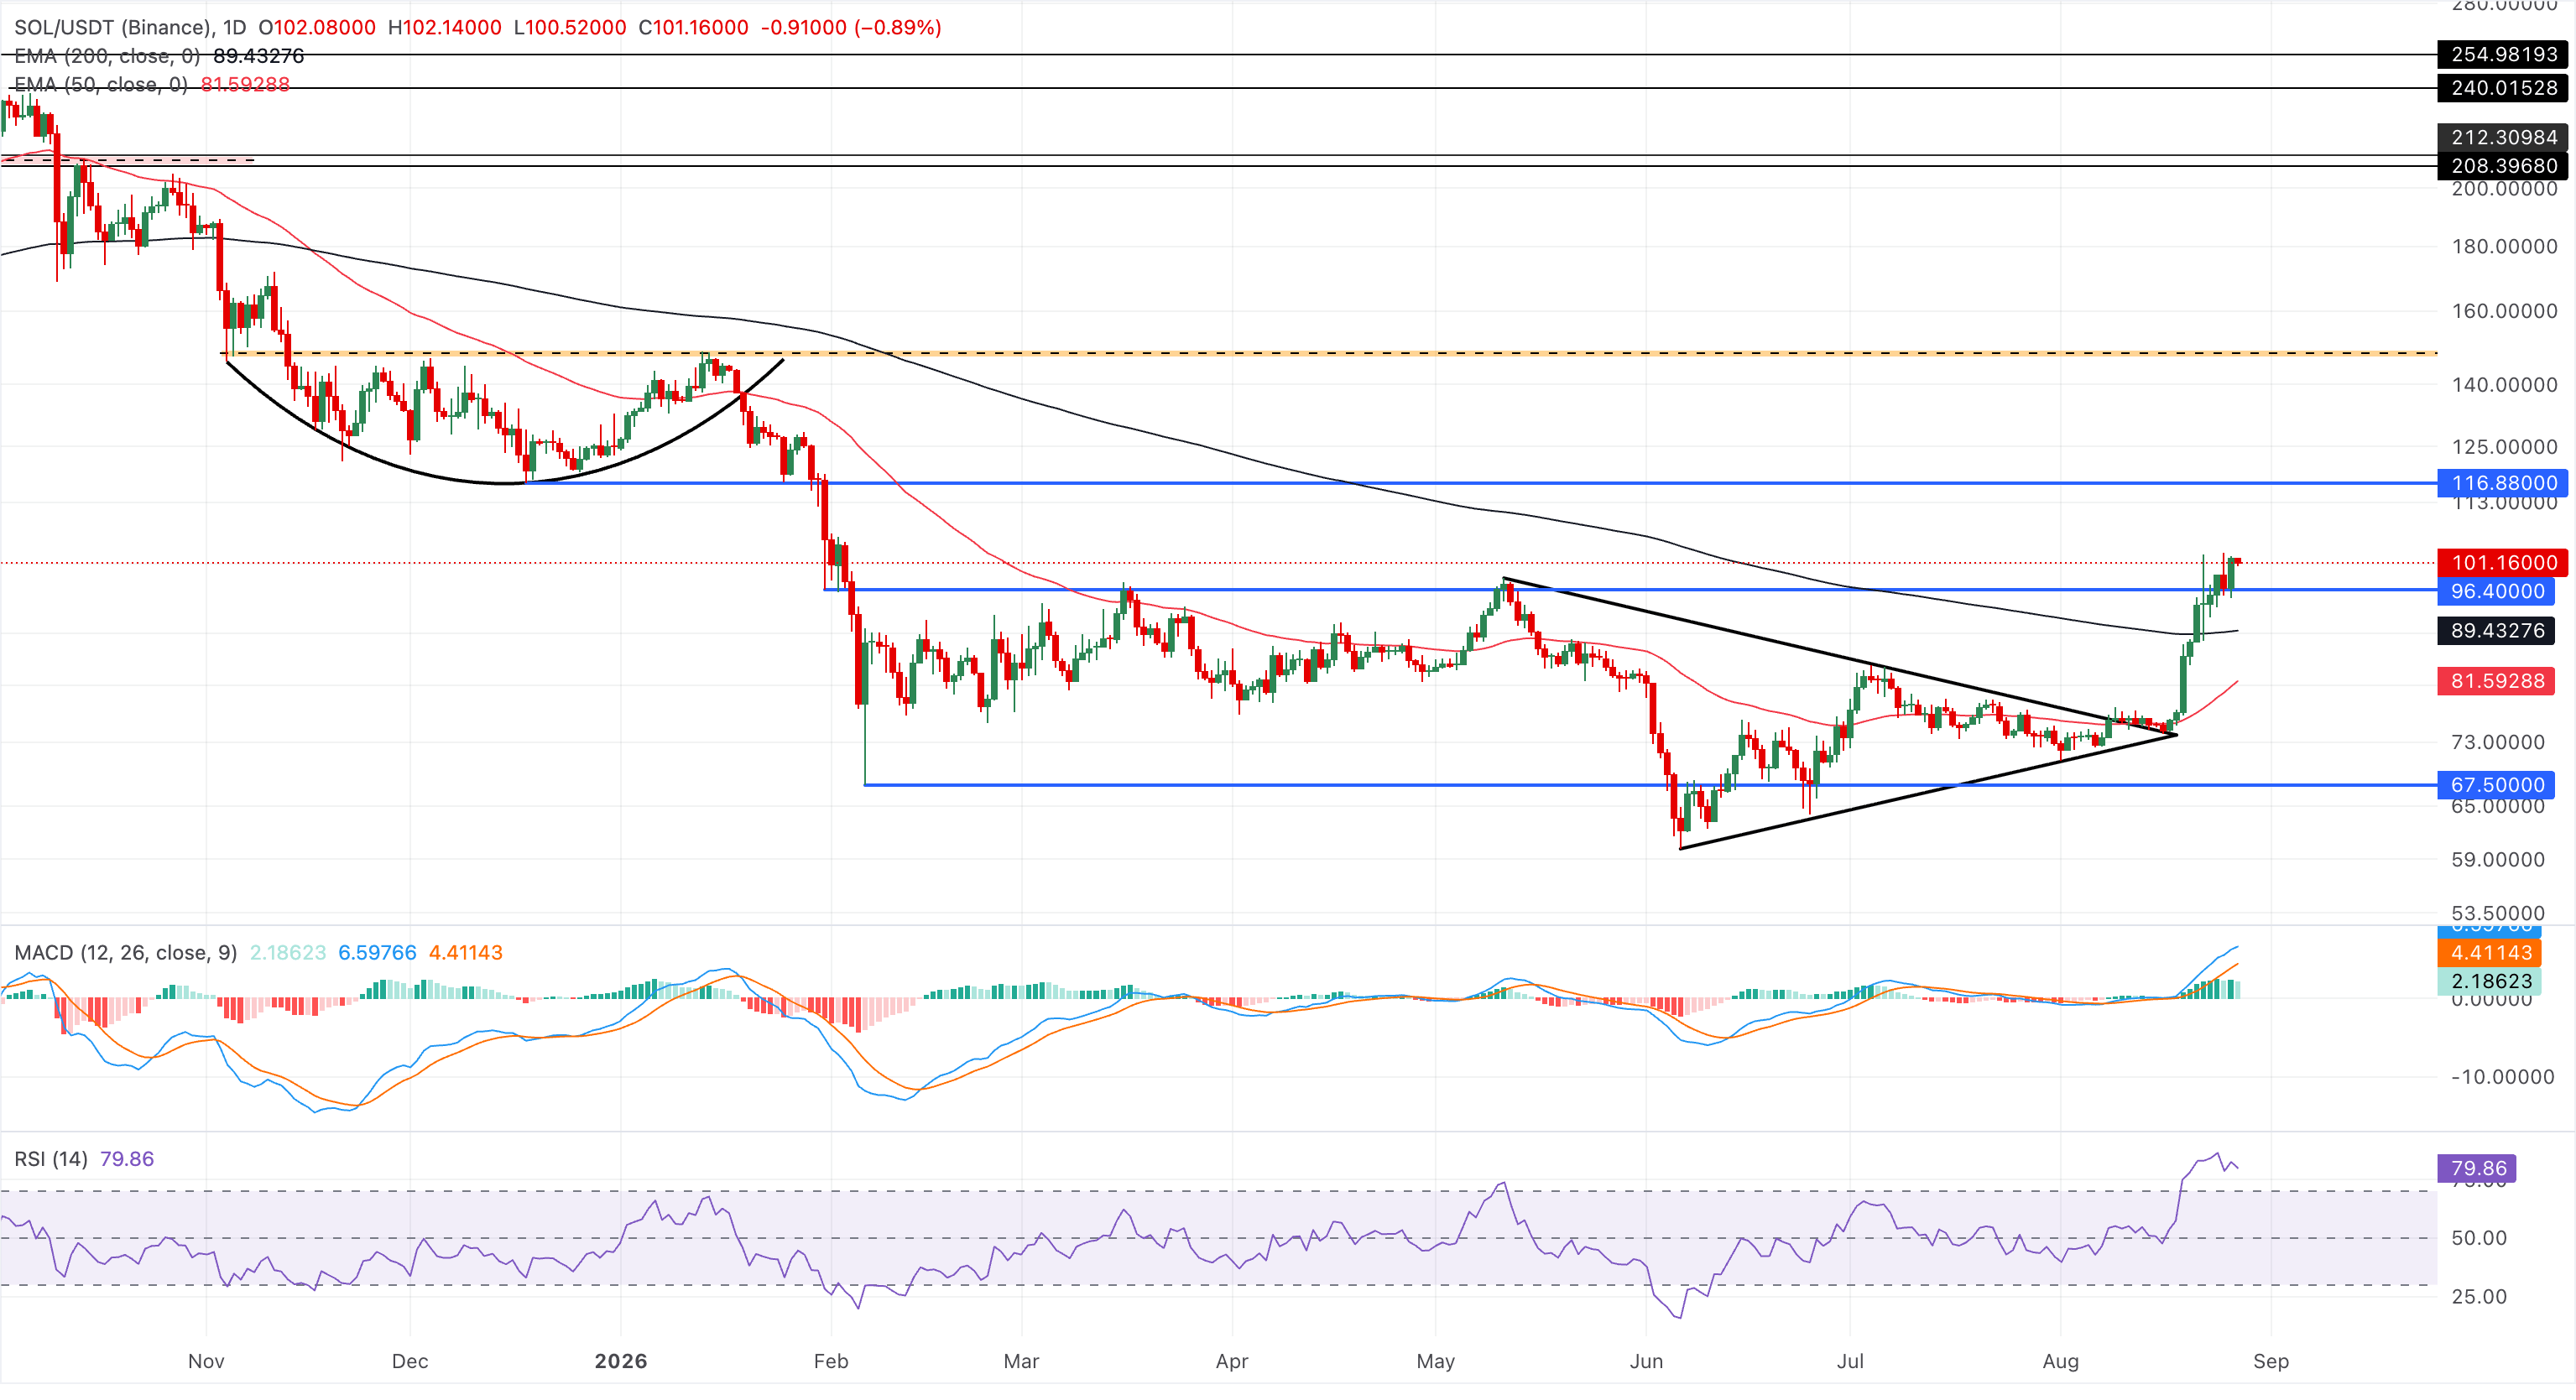
Initial support is seen at the latest breakout area of the January 31 low at $96.40, followed by the 200-day EMA at $89.43 and the 50-day EMA at $81.59.
Dogecoin capped below $0.10 as profit-taking cools momentum
Dogecoin trades above $0.0800 on Thursday, holding a mild bullish near‑term bias, with price well above the 50‑day EMA at $0.0775. The meme coin remains capped below the resistance cluster of the 200-day EMA at $0.0952 and the $0.1000 psychological threshold.
The RSI around 64 exits the overbought zone, while the MACD and signal line remain above zero as the bullish profile wanes, suggesting that upward momentum is cooling.
Dogecoin must clear the $0.1000 mark for an extended rally toward the December 31 low at $0.1161.
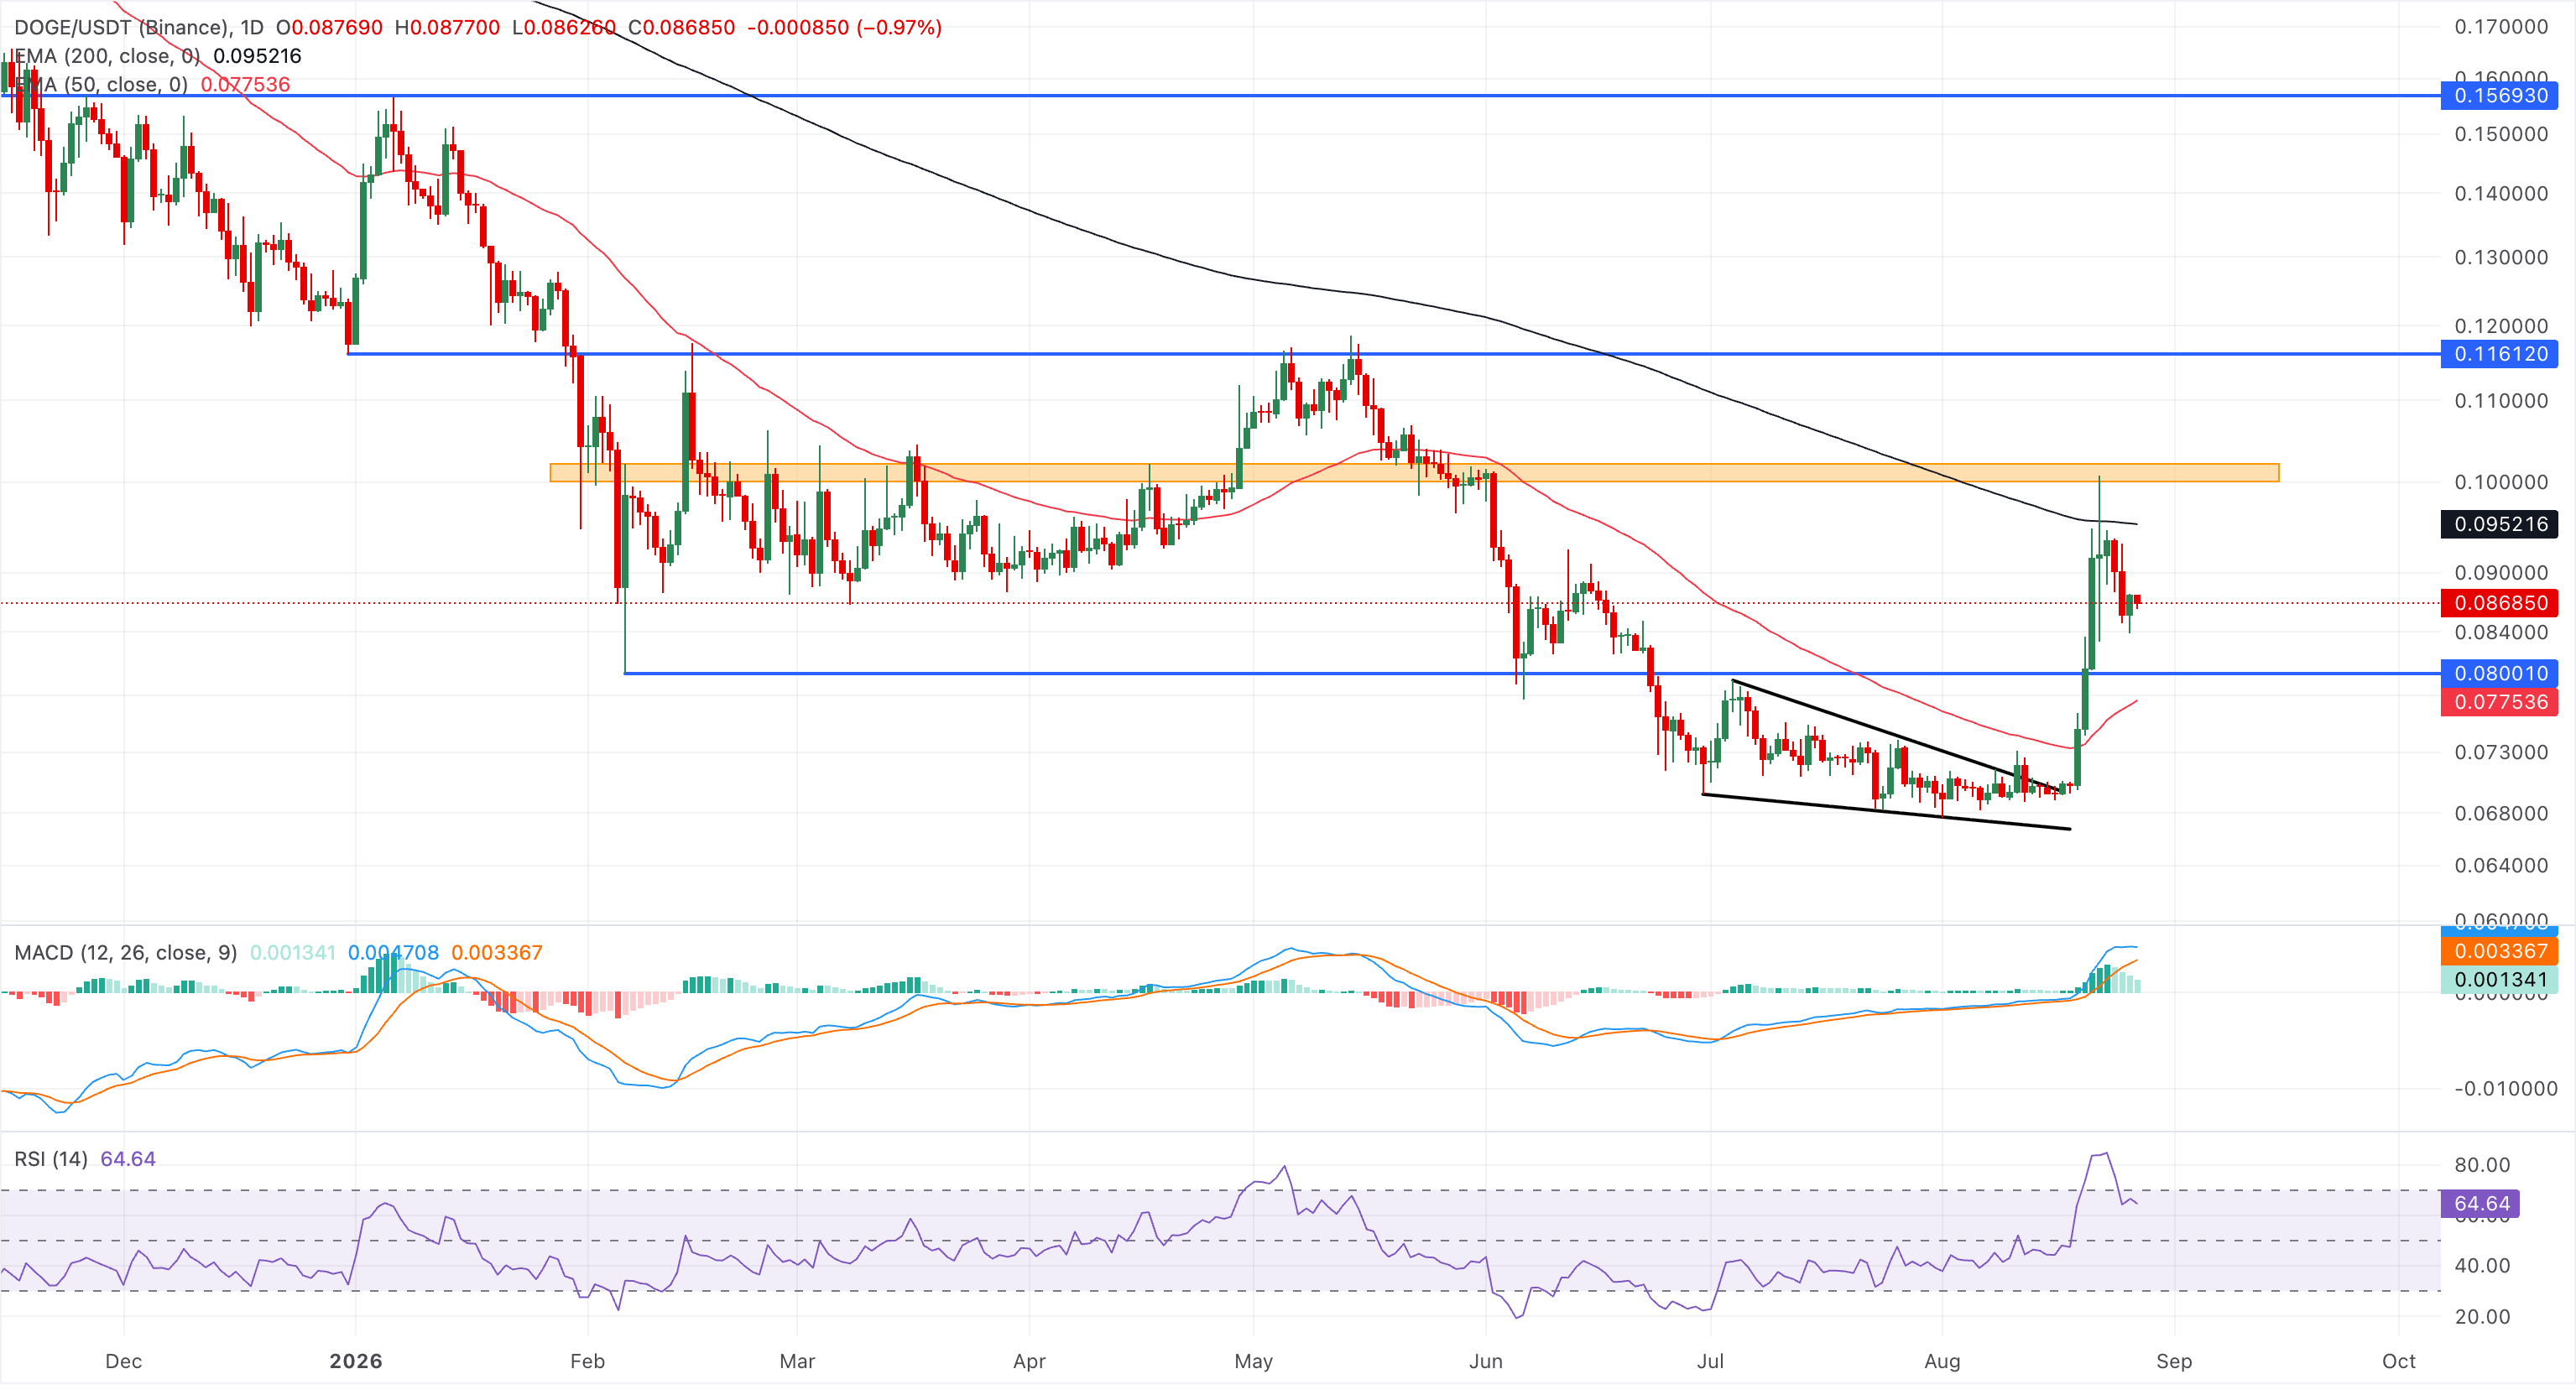
On the downside, immediate support is seen at the reclaimed February 6 low at $0.0800 and the 50‑day EMA at $0.0775, where a deeper pullback would be expected to attract dip buyers while price remains above this zone.
(The technical analysis of this story was written with the help of an AI tool. Know more.)
Author

Vishal Dixit
FXStreet
Vishal Dixit holds a B.Sc. in Chemistry from Wilson College but found his true calling in the world of crypto.




