Top 5 cryptocurrencies to watch this week: BTC, DOT, SAND, RUNE, ZEC

BTC’s technical setup suggests a potential breakout to the upside and charts suggest DOT, SAND, RUNE and ZEC would be the first to benefit from any bullish price action.
Bitcoin (BTC) has been relatively calm during the weekend, indicating that traders are playing it safe and not waging large bets before the upcoming Federal Open Market Committee meeting on March 15 and March 16. The quantum of the rate hike could act as the next trigger for the crypto markets.
The current neutral setup of Bitcoin has kept the analysts guessing. Analytics resource Material Indicators warned that Bitcoin could plunge but they advised investors to be ready to buy the dip as they believe that the “bounce can change your life.”
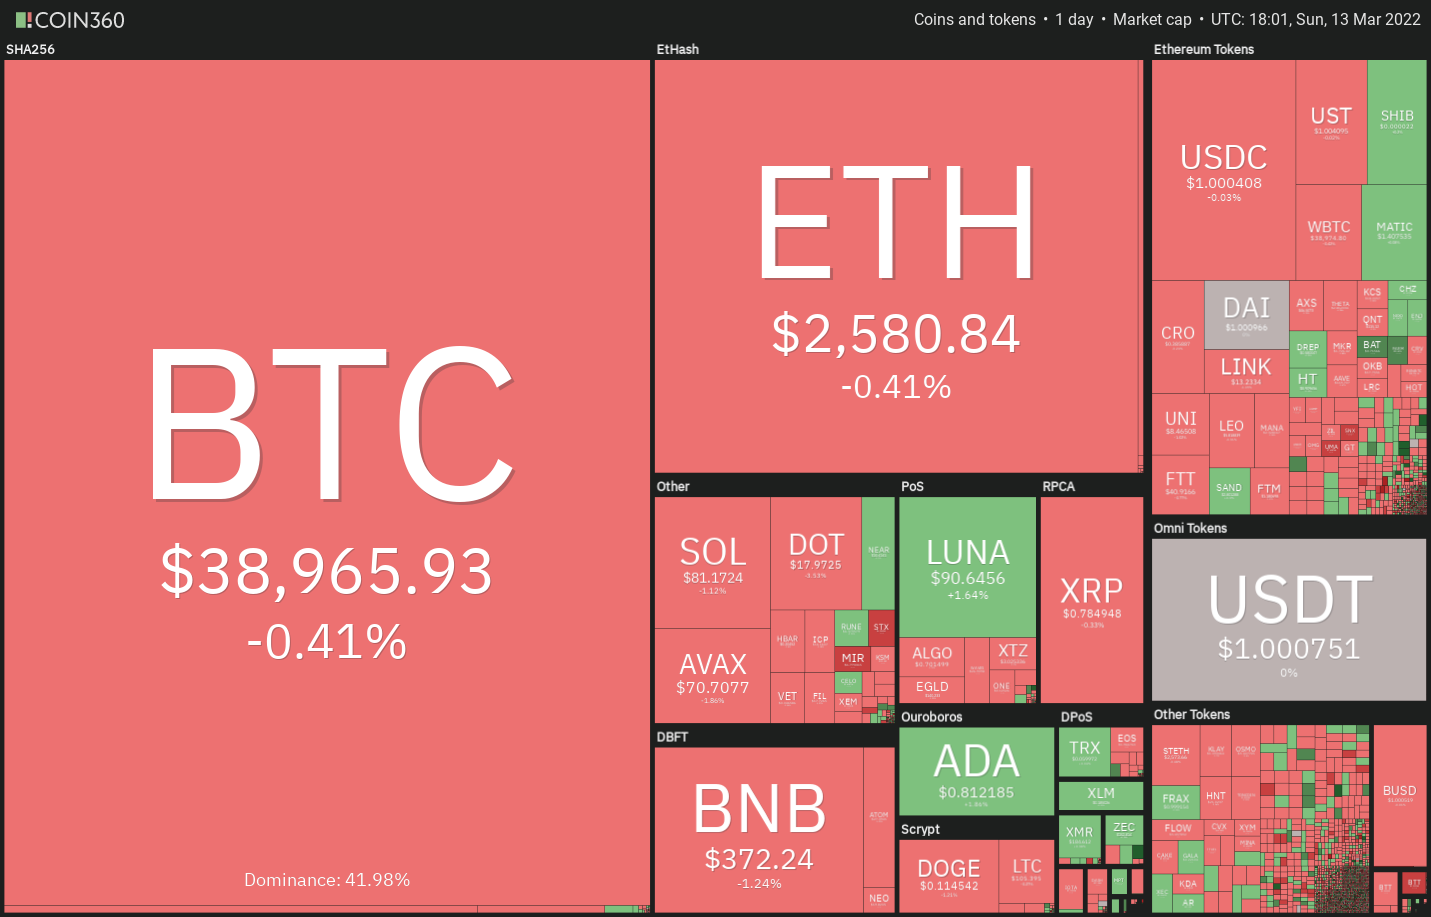
Crypto market data daily view. Source: Coin360
A Price Waterhouse Coopers' Sports Outlook 2022 report for North America highlighted three use cases for nonfungible tokens, which could shape the future of sports. The consultancy believes that NFTs and digital assets are among the ten major trends in the sports industry.
Could the crypto markets start a directional move in the near term? Let’s study the charts of the top-5 cryptocurrencies that may participate in a rally if the bullish sentiment picks up.
BTC/USDT
Bitcoin formed a Doji candlestick pattern on March 12 and on Sunday, indicating indecision among the bulls and bears. The price is stuck between the 20-day exponential moving average ($39,810) and the horizontal support at $37,000.
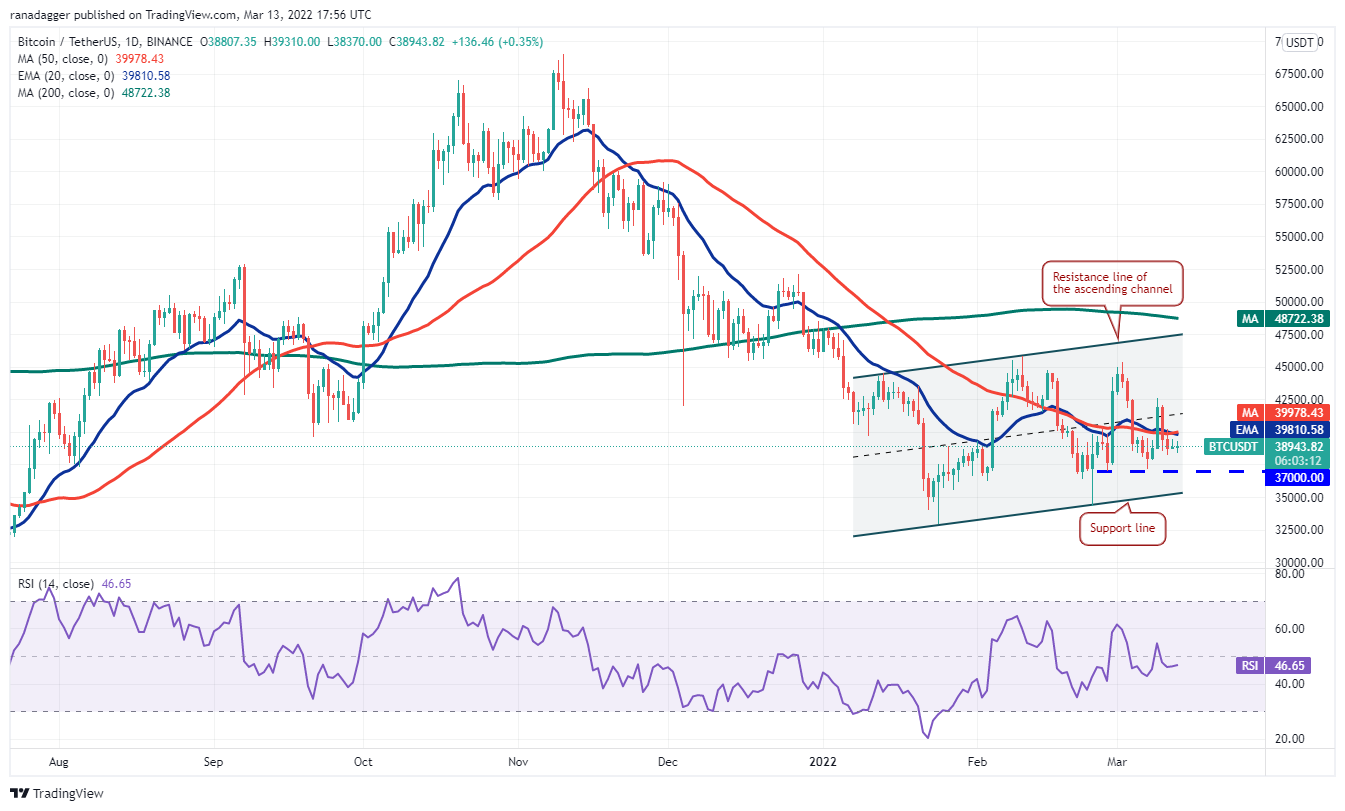
BTC/USDT daily chart. Source: TradingView
The 20-day EMA is flattish and the relative strength index (RSI) is just below the midpoint, indicating a balance between supply and demand.
If the price rises and breaks above the 50-day simple moving average ($39,978) the bulls will attempt to push the BTC/USDT pair above $42,600. If they succeed, the pair could rally to $45,400 and later to the resistance line of the channel.
Conversely, if the price turns down and breaks below $37,000, the bears will smell an opportunity. The sellers will then try to pull and sustain the pair below the support line of the channel. Such a move could clear the path for a possible drop to $30,000.
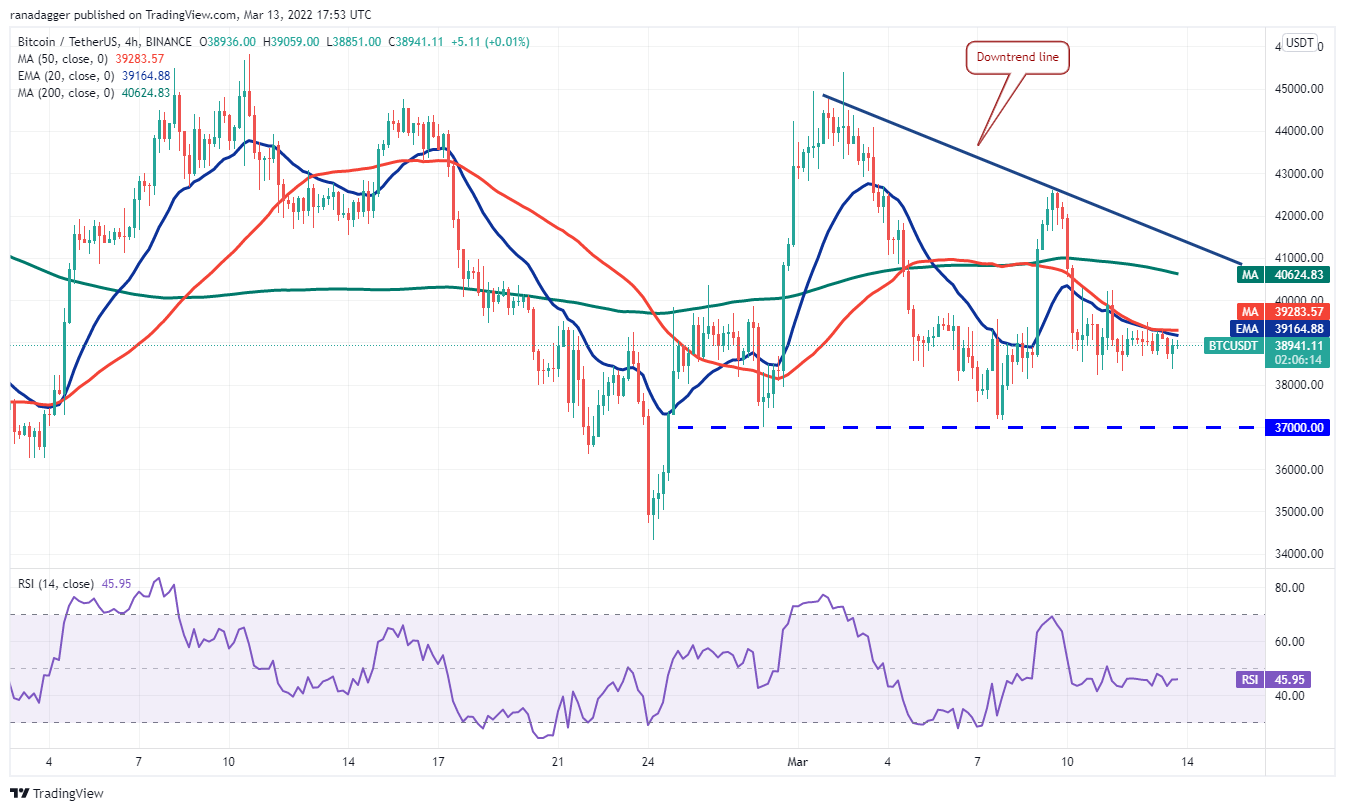
BTC/USDT 4-hour chart. Source: TradingView
The pair is forming a descending triangle pattern which will complete on a break and close below the strong support at $37,000. The pair could then drop to $34,322 and later start its journey toward the pattern target at $29,250.
Alternatively, if bulls push and sustain the price above the 50-SMA, the pair could rise to the downtrend line. A break and close above this level will invalidate the bearish pattern. That could attract buying and the pair may then rally toward $45,400.
DOT/USDT
Polkadot (DOT) has been in a downtrend for the past several months but the bulls are trying to form a bottom in the zone between $16 and $14. The price rose above the 20-day EMA ($17) but the bulls have not been able to overcome the barrier at the 50-day SMA ($18).
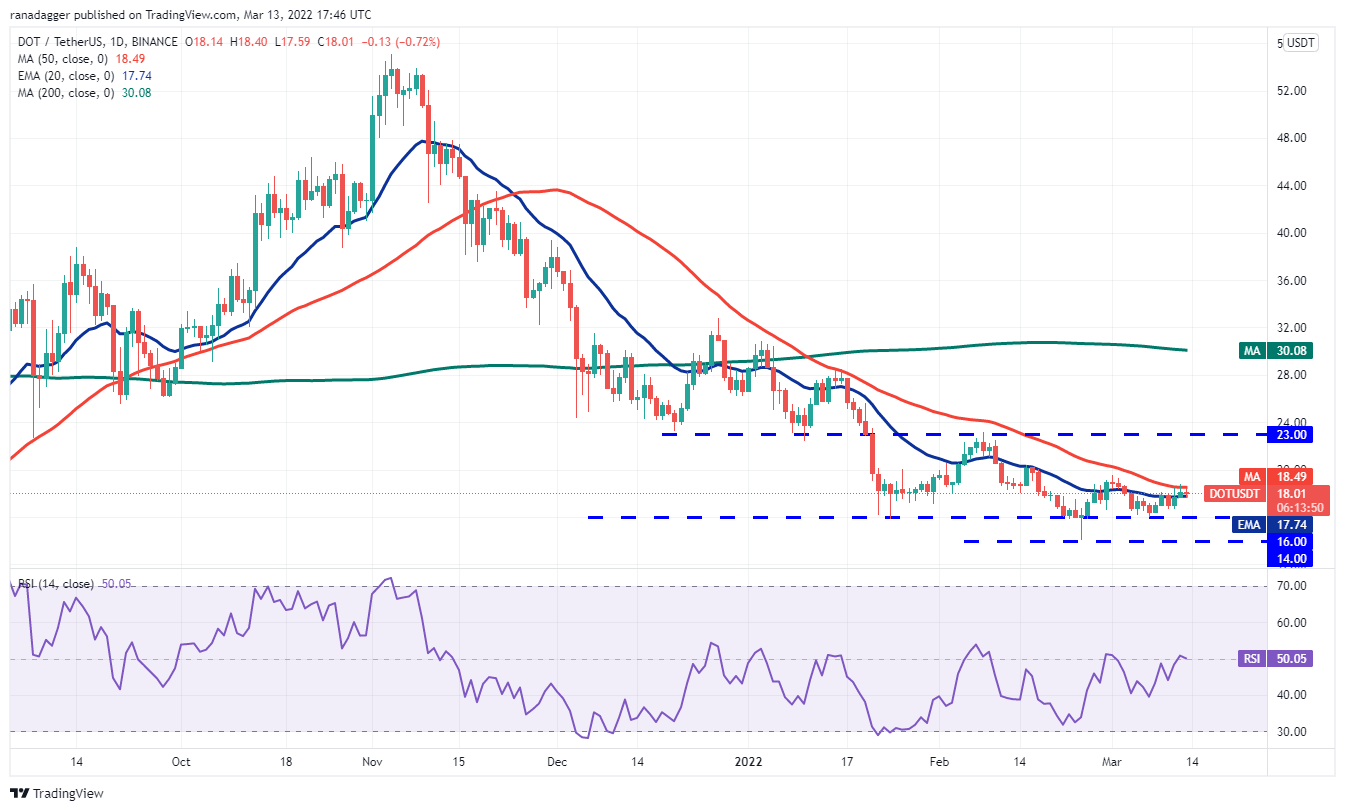
DOT/USDT daily chart. Source: TradingView
However, a positive sign is that the bulls have not given up much ground from the 50-day SMA. This suggests that the traders may be holding on to their position anticipating a break above the resistance. If that happens, the DOT/USDT pair could rally to the overhead resistance at $23 where the bears may again pose a stiff challenge.
The flattish 20-day EMA and the RSI near the midpoint suggest a range-bound action in the short term. If the price turns down from the 50-day SMA, the bears will try to pull the pair below $16. If they succeed, the pair could retest the critical support at $14.
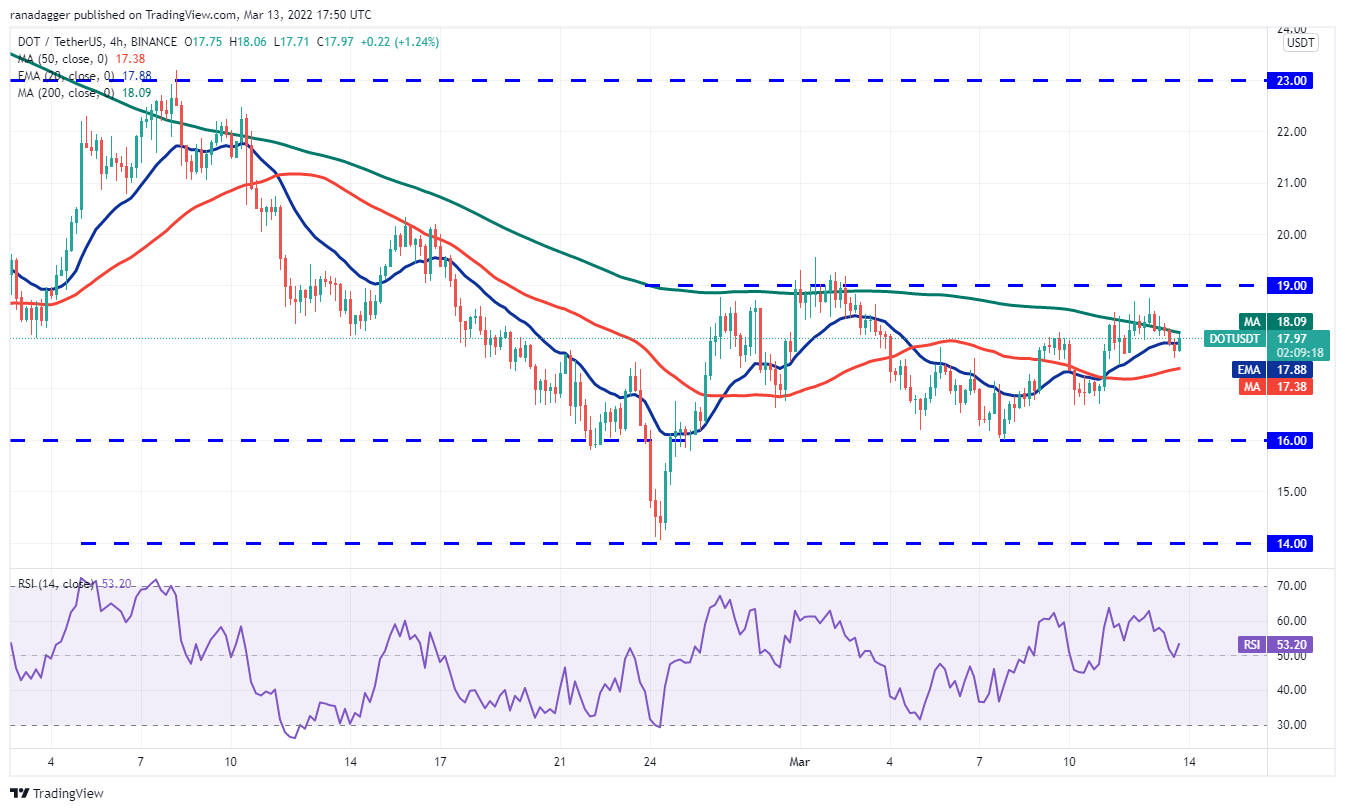
DOT/USDT 4-hour chart. Source: TradingView
The 4-hour chart shows that the pair is oscillating between $16 and $19. The failure of the buyers to propel the price above the overhead resistance may have attracted profit-booking from short-term traders. That pulled the price to the 50-SMA.
If the price rises above the 200-SMA, it will suggest that bulls continue to buy on dips. The buyers will then again try to drive the price above the overhead resistance at $19. If they manage to do that, the pair could rise to $20 and later make a dash toward $23.
Conversely, a break and close below the 50-SMA may increase the possibility of a drop to the strong support at $16.
SAND/USDT
The Sandbox (SAND) has been range-bound between $2.55 and $4.86 for the past several weeks. The bears pulled the price below the 200-day SMA ($3.15) on March 4 but haven’t been able to break the support at $2.55.
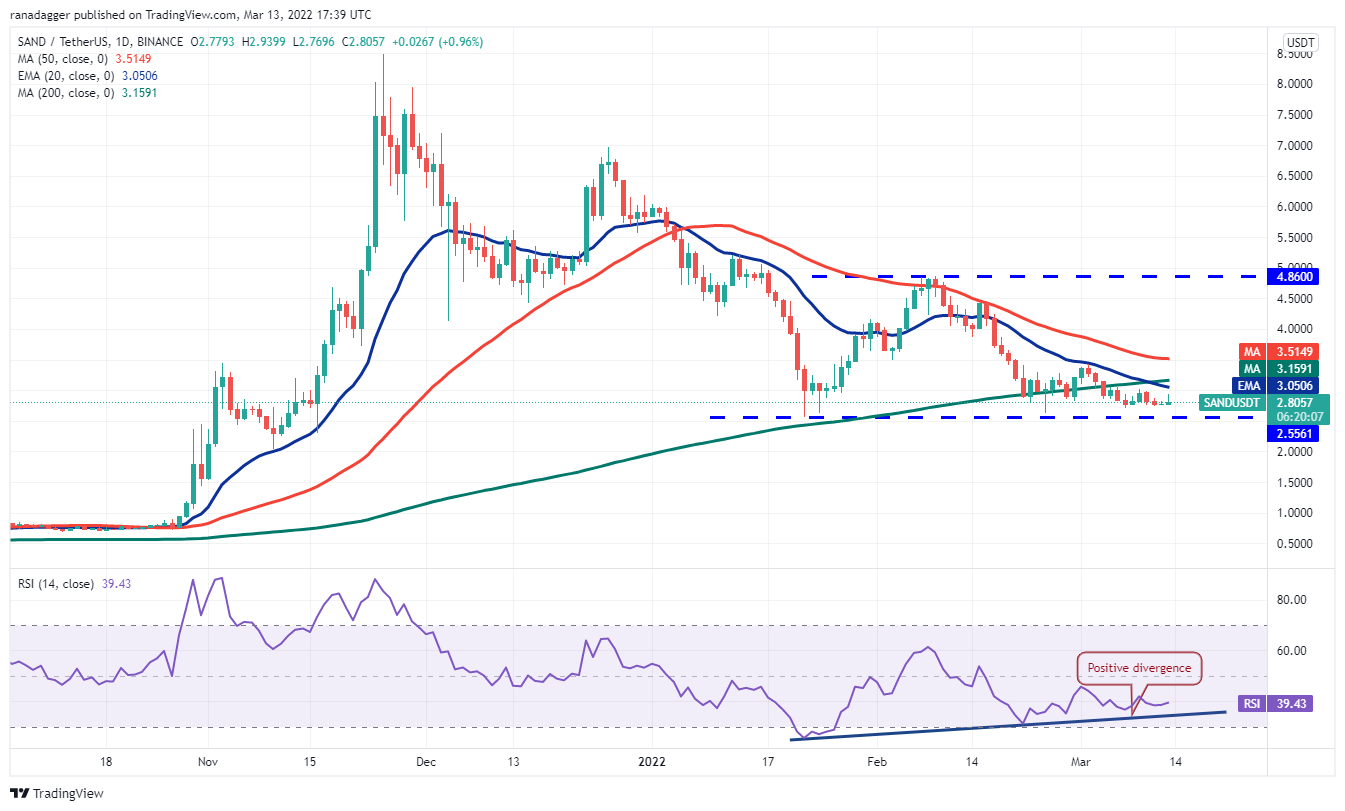
SAND/USDT daily chart. Source: TradingView
This indicates accumulation near the support of the range. The RSI is showing signs of a positive divergence, indicating that the bearish momentum may be weakening.
If the price rises from the current level, the bulls will try to push the SAND/USDT pair above the 200-day SMA. If that happens, the pair could rise to the 50-day SMA ($3.51). A break and close above this resistance could open the doors for a possible rally to $4.50 and then to $4.86.
This bullish view will invalidate in the short term if the price turns down and slides below $2.55. That could suggest the resumption of the downtrend.
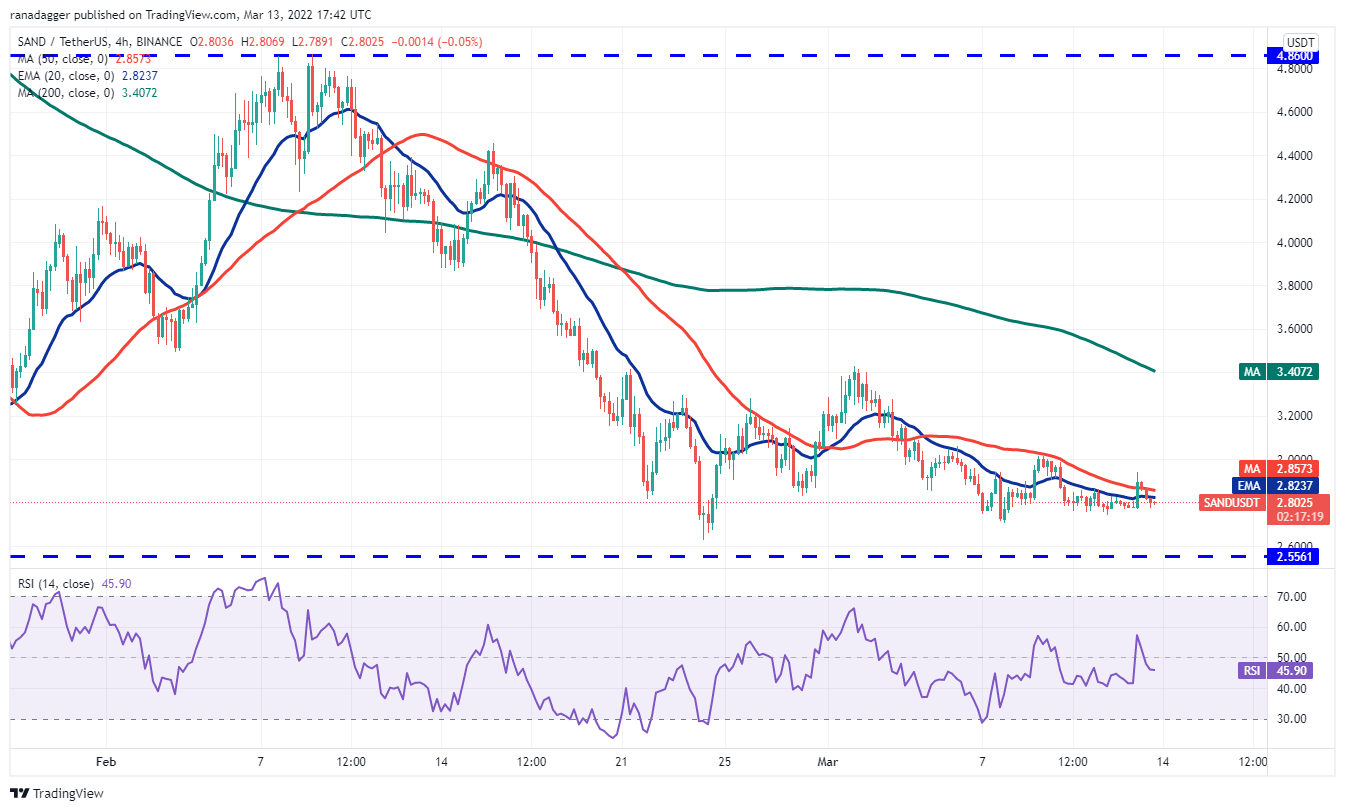
SAND/USDT 4-hour chart. Source: TradingView
The 50-SMA has been acting as a stiff resistance on the 4-hour chart. If bears sink the price below $2.70, the pair could drop to the solid support at $2.55. A break and close below this level could indicate advantage to bears.
To negate this view, the bulls will have to push the price above the zone between the 50-SMA and $3. If that happens, the pair could rally to $3.42 where the bears may again mount a strong defense.
RUNE/USDT
THORChain (RUNE) broke above the moving averages on March 1 and successfully defended the level during the retest on March 8. This suggests that the sentiment has changed from sell on rallies to buy on dips.
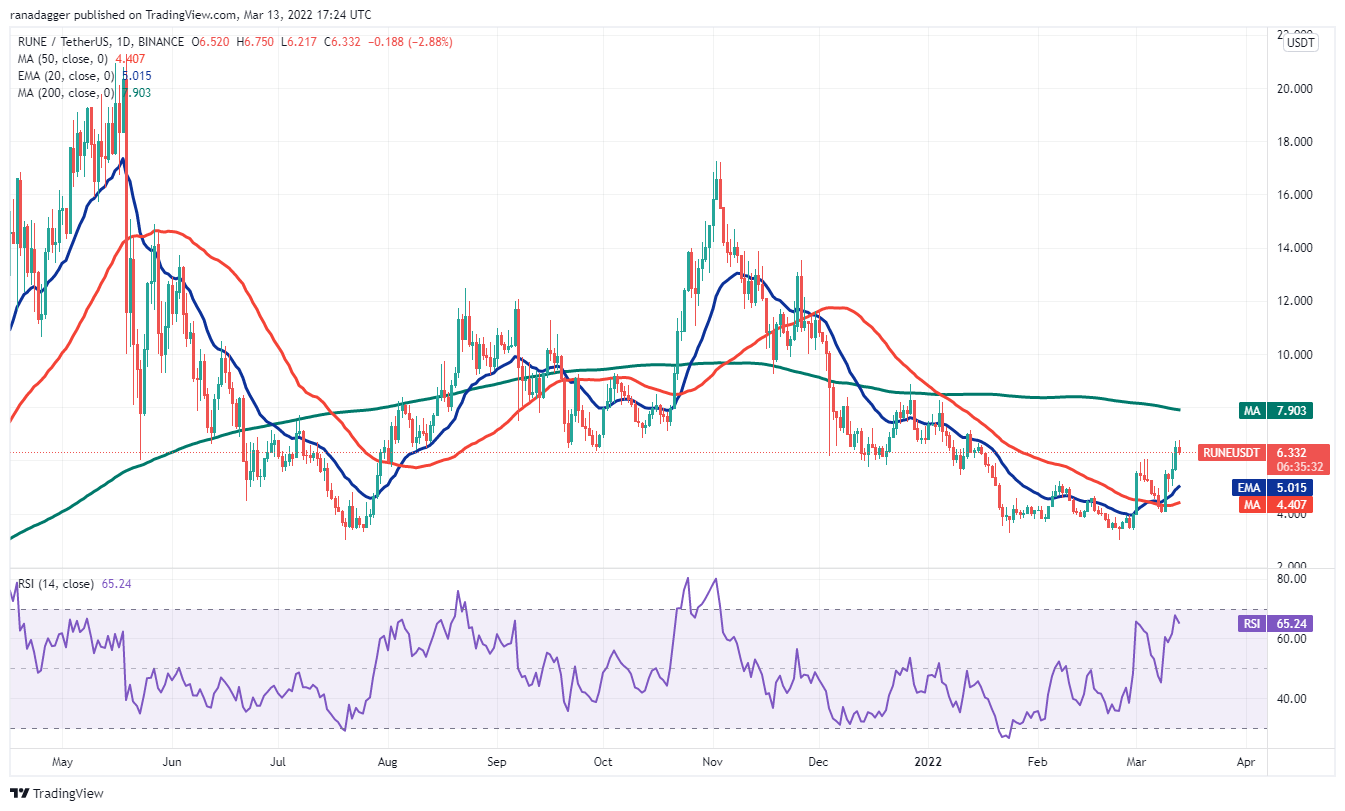
RUNE/USDT daily chart. Source: TradingView
The bulls will now try to push the price to the 200-day SMA ($7.90) where the bears may again pose a strong challenge. If the price does not give up much ground from the 200-day SMA, the bulls will make one more attempt to clear this hurdle. If they succeed, the RUNE/USDT pair could rise to $9.
Alternatively, if the price turns down from the current level, the 20-day EMA is the important level to watch out for. A strong rebound off this level will suggest that the bullish sentiment remains intact while a break below it could result in a decline to $4.
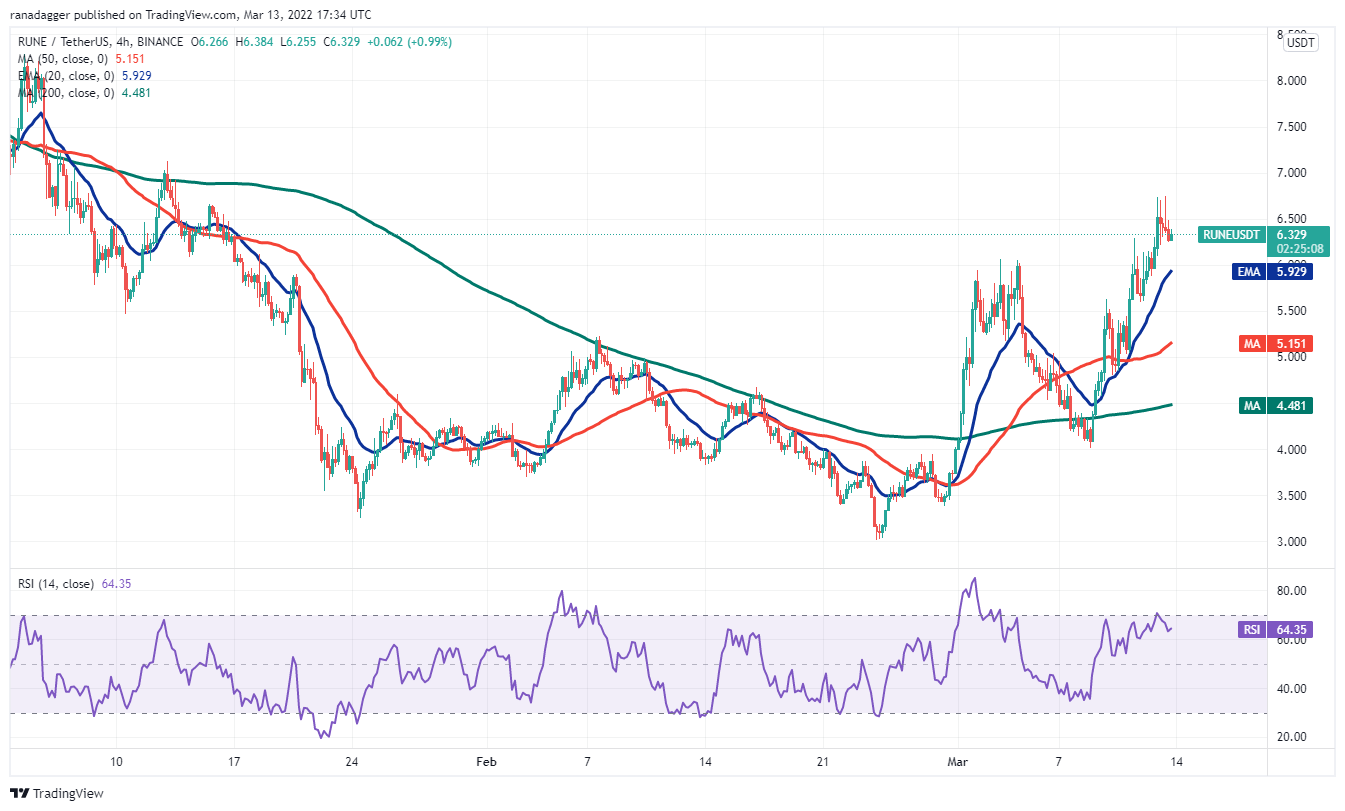
RUNE/USDT 4-hour chart. Source: TradingView
The 20-EMA on the 4-hour chart is sloping up and the RSI is in the positive zone, indicating that the bulls have the upper hand. The pair could now rise to the overhead resistance at $7 where the bears will try to stall the up-move.
Alternatively, if the price turns down from the current level, the pair could drop to the 20-EMA. If the price rebounds off this level, the bulls will attempt to resume the uptrend. The bears will have to pull and sustain the price below the 20-EMA to indicate a change in the short-term trend.
ZEC/USDT
Zcash (ZEC) broke and closed above the $135 resistance on March 8, which completed a double bottom pattern. This was followed by a break above the 200-day SMA ($145) on March 10, signaling that bulls are back in the game.
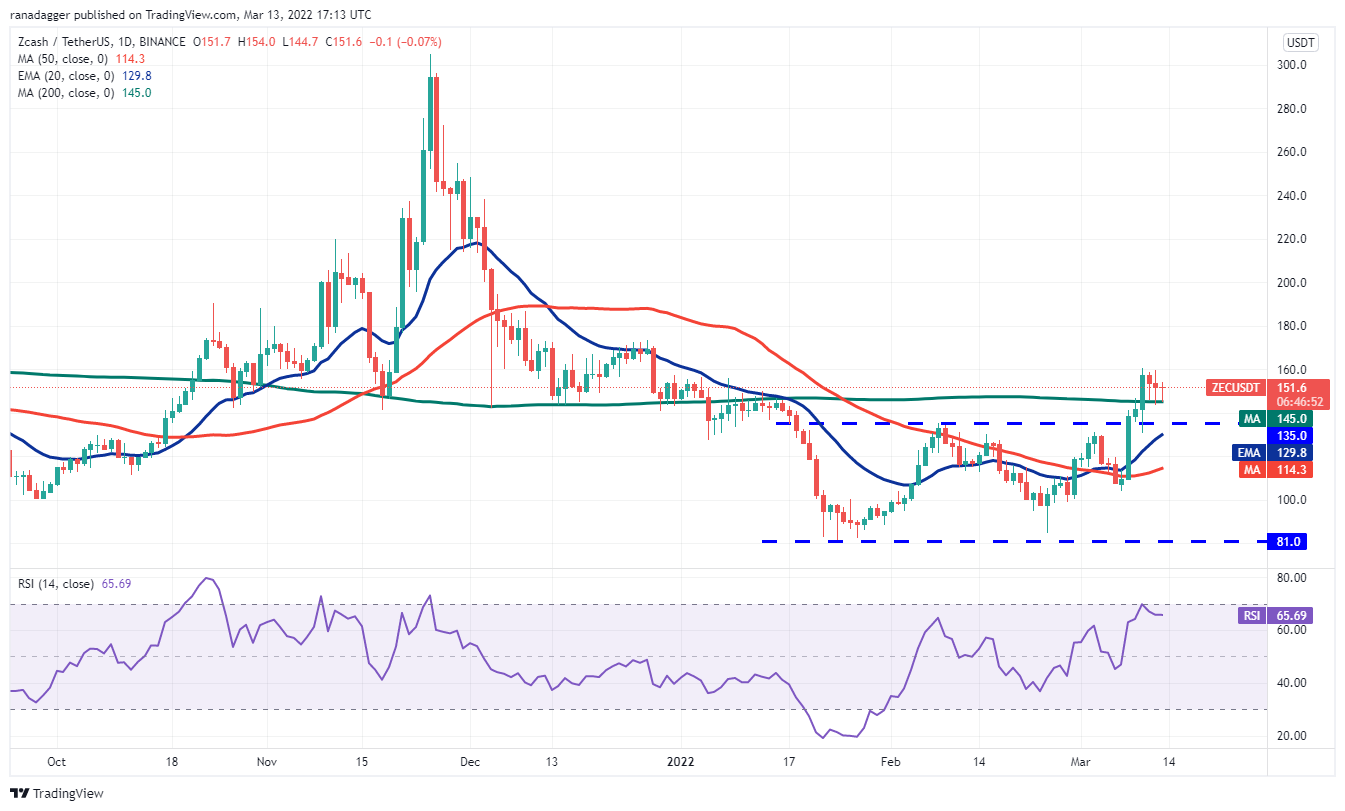
ZEC/USDT daily chart. Source: TradingView
The bears are currently attempting to pull the price back below the 200-day SMA and challenge the breakout level at $135. This is an important level for the bulls to defend because a break below it could suggest that the recent breakout may have been a bear trap. The ZEC/USDT pair could then drop to the 50-day SMA ($114).
If the price rebounds off the current level or $135, it will suggest that the sentiment remains positive and traders are buying on dips. The bulls will then try to drive the pair above $160 and resume the up-move. The target objective of the breakout from the double bottom pattern is $189.
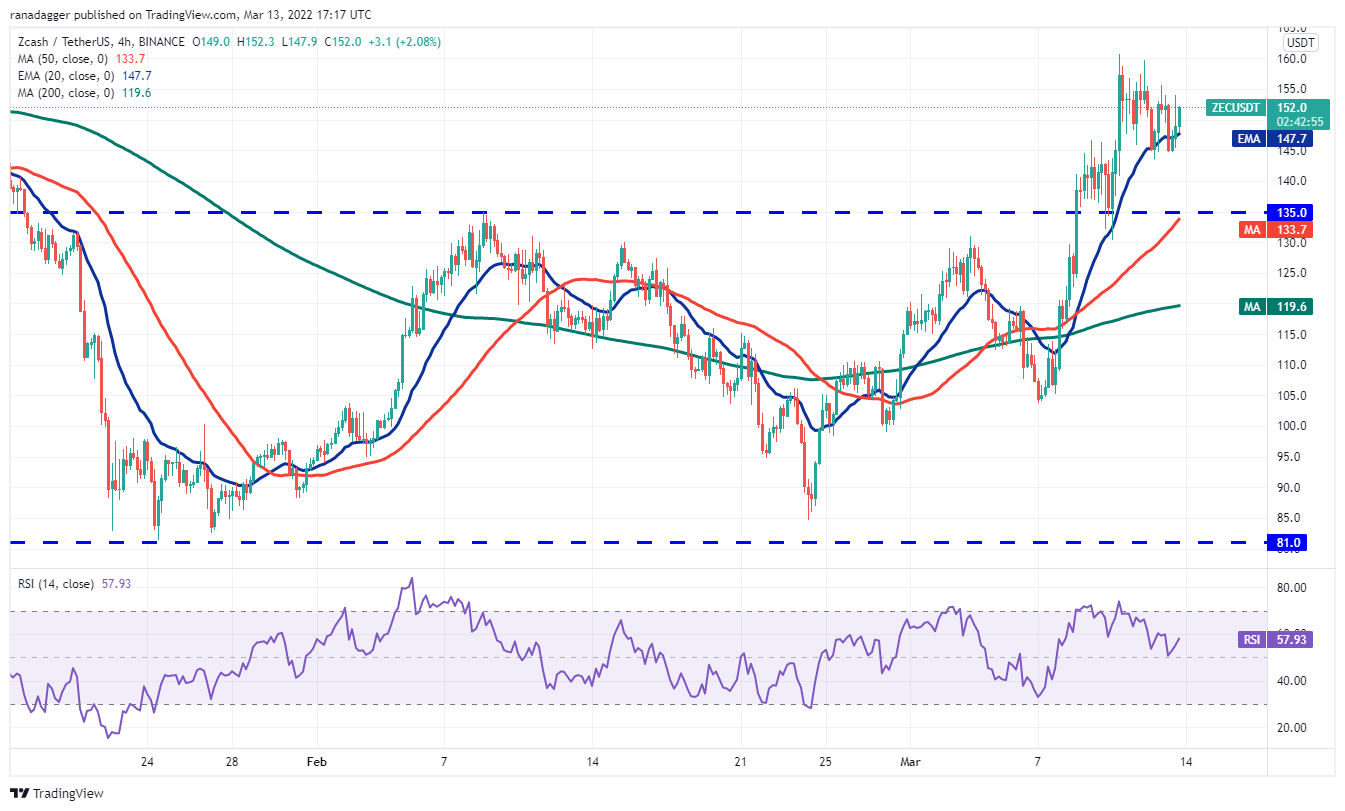
ZEC/USDT 4-hour chart. Source: TradingView
The bears pulled the price below the 20-EMA on the 4-hour chart but they have not been able to sustain the lower levels. This suggests that bulls continue to buy on every minor dip. The bulls will now try to push the price above $160 and resume the uptrend. The rising 20-EMA and the RSI in the positive territory indicate that the path of least resistance is to the upside.
Contrary to this assumption, if the price turns down from the overhead resistance and slips below $143, the selling could pick up momentum. The pair could then drop to the critical support at $135.
Author

Cointelegraph Team
Cointelegraph
We are privileged enough to work with the best and brightest in Bitcoin.