- Consolidation continues and aims for resolution by early February.
- Improved global risk perception is holding back prices at key resistance levels.
- The battle to know how to classify the XRP adds uncertainty to the price.
The Top 3 cryptocurrencies continue to move within neutral scenarios while waiting for fresh money to take them to the next bullish scenario that is a few dollars above.
The European morning in crypto market starts in the red as the predominant color among the top 10 coins. Only BNB stands out with a modest gain of +0.42%, while Bitcoin SV crashes -17.8% in line with the magnitude of previous falls.
Among the Top 3 cryptocurrencies, there are very discrete declines, a sign of strength after the significant gains of the last few days. It is selling slowly and gradually. However, when it comes to buying, it is doing it so quickly and is accompanied by high volume.
ETH/BTC Weekly Chart
ETH/BTC is currently trading at the price level of 0.01865. The upside scenario is very close, with the cross now trading above the 0.020 level – although the task is to break out of the SMA100 and SMA200. These two moving averages are still tilted downwards. If everything points to a continuation of the upward movement, a change in the tilt of the long-term moving averages could take several months to be completed.
Above the current price, the first resistance level is at 0.0189, then the second at 0.020 and the third one at 0.022.
Below the current price, the first support level is at 0.018, then the second at 0.017, and the third one at 0.0163.
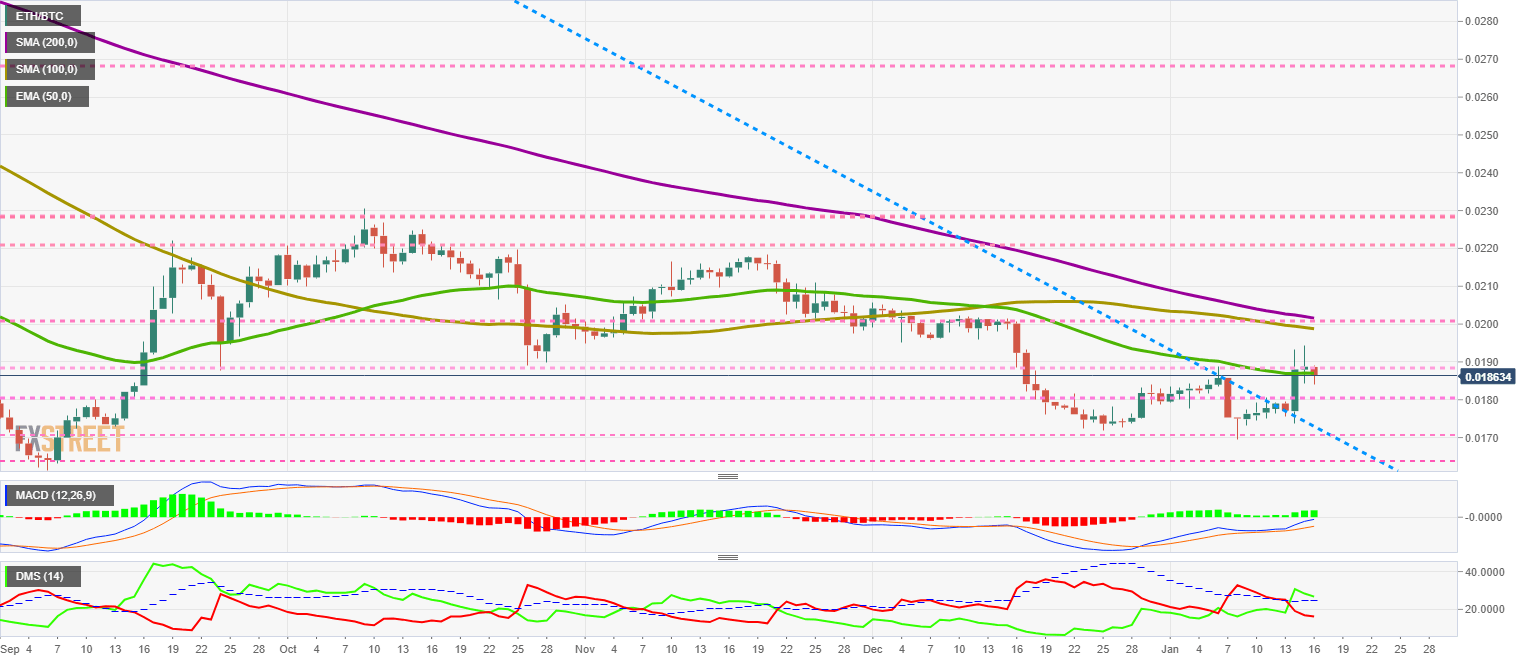 The MACD on the daily chart reaches the neutral level of the indicator, a process that usually slows down the current trend. The moving averages retain the slope and also the opening between the lines. In the next few days, the price should remain in the current range or slightly down.
The DMI on the daily chart shows that bulls are descending to the ADX line to seek confirmation. It is a typical pattern that should develop again with more intensity than in the previous bullish section.
BTC/USD Weekly Chart
BTC/USD is currently trading at $8,617, unable to break through the price congestion resistance at $8,800. The bullish scenario is above $9,000 but needs to overtake the SMA200 and the long term downward trend.
The EMA50 leans aggressively upward and inevitably heads for the upward cross above the SMA100 and 200. Until then, the price could orbit around the SMA200.
Above the current price, the first resistance level is at $8,800, then the second at $9,150 and the third one at $9,500.
Below the current price, the first support level is at $8,500, then the second at $8,200 and the third one at $8000.
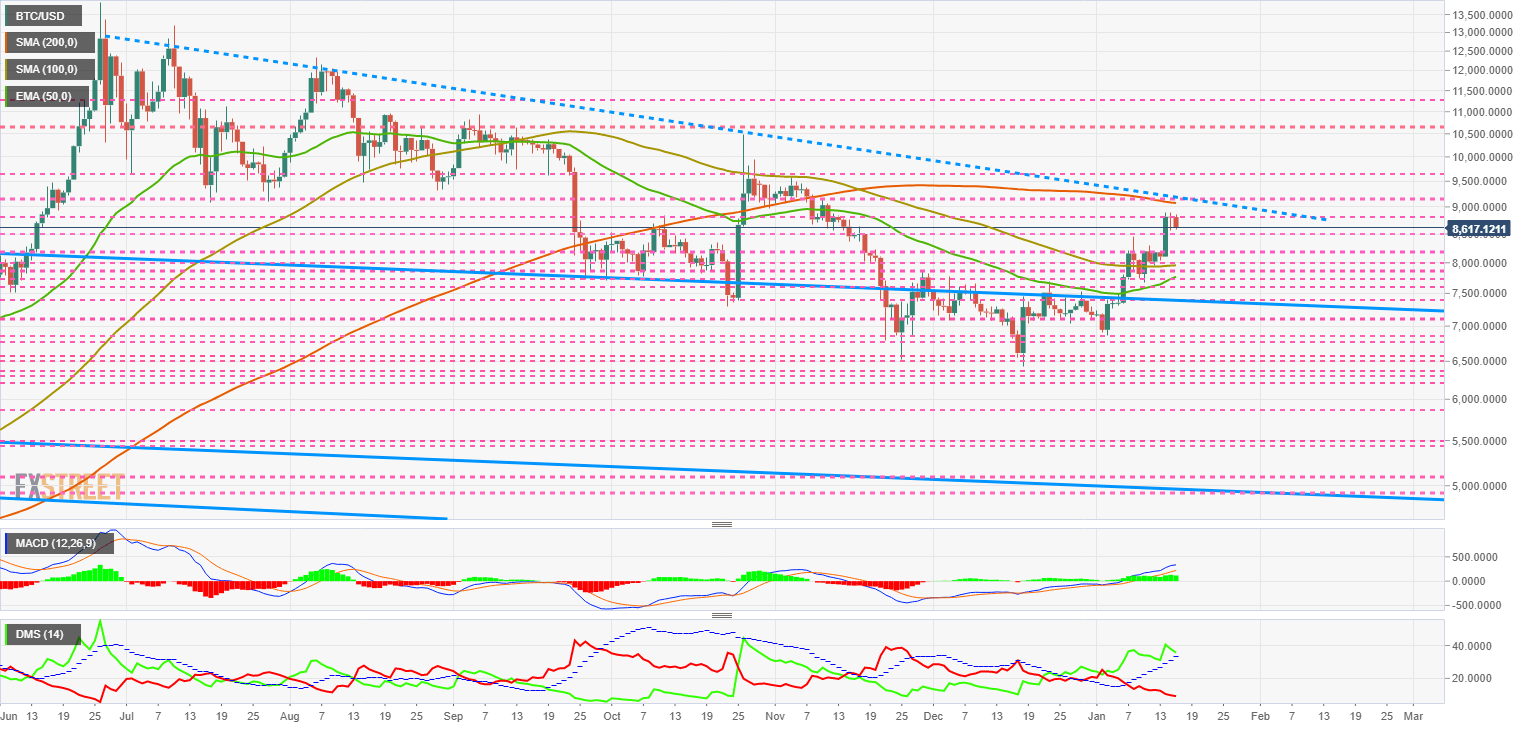 The MACD indicator on the daily chart shows a fully bullish profile both by the tilt of the moving averages and by the distance between them. This setup suggests a continuation of the current bullish trend.
The DMI on the daily chart continues to dominate the pair and is moving above the ADX line. The bears continue to lose strength and give up competing for the leadership in the order book.
ETH/USD Weekly Chart
The ETH/USD is currently trading at $160.77 and finds support above the SMA100. The upside scenario is above the $191 level and as with the BTC/USD, above significant technical resistance.
Above the current price, the first resistance level is at $162, then the second at $170 and the third one at $180.
Below the current price, the first support level is at $155, then the second at $150.8 and the third one at $142.5.
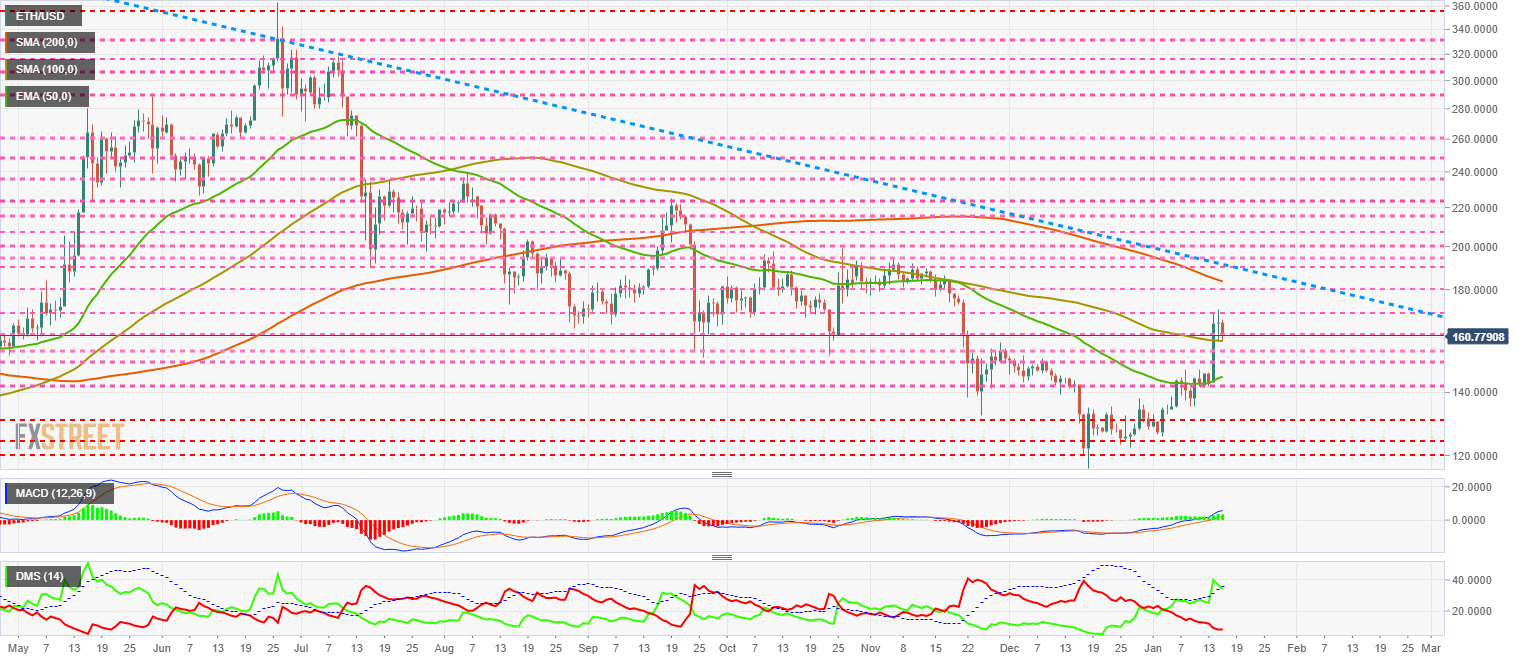 The MACD on the daily chart crosses cleanly above the neutral zone and enters the bullish area, maintaining the upward slope and the opening between the lines. The forecast is for a continuation of the current bullish trend.
The DMI on the daily chart shows the bulls controlling the ETH/USD pair while the bears are giving up the fight for the lead. The buy-side remains above the ADX line, and as long as this is the case, the bullish pattern will continue.
XRP/USD Weekly Chart
The XRP/USD is currently trading at the price level of $0.2244 and has failed to cross over the long term downward trend yesterday. The signal is negative and a sign of weakness.
XRP is in the headlines because of a possible ruling by a US judge regarding its possible categorization as equity. Ripple Ltd is making allegations against this possibility but based on legal loopholes rather than substantial arguments.
Above the current price, the first level of resistance is at $0.024, then the second at $0.245 and the third one at $0.268.
Below the current price, the first level of support is at $0.217, then the second at $0.20 and the third one at $0.19.
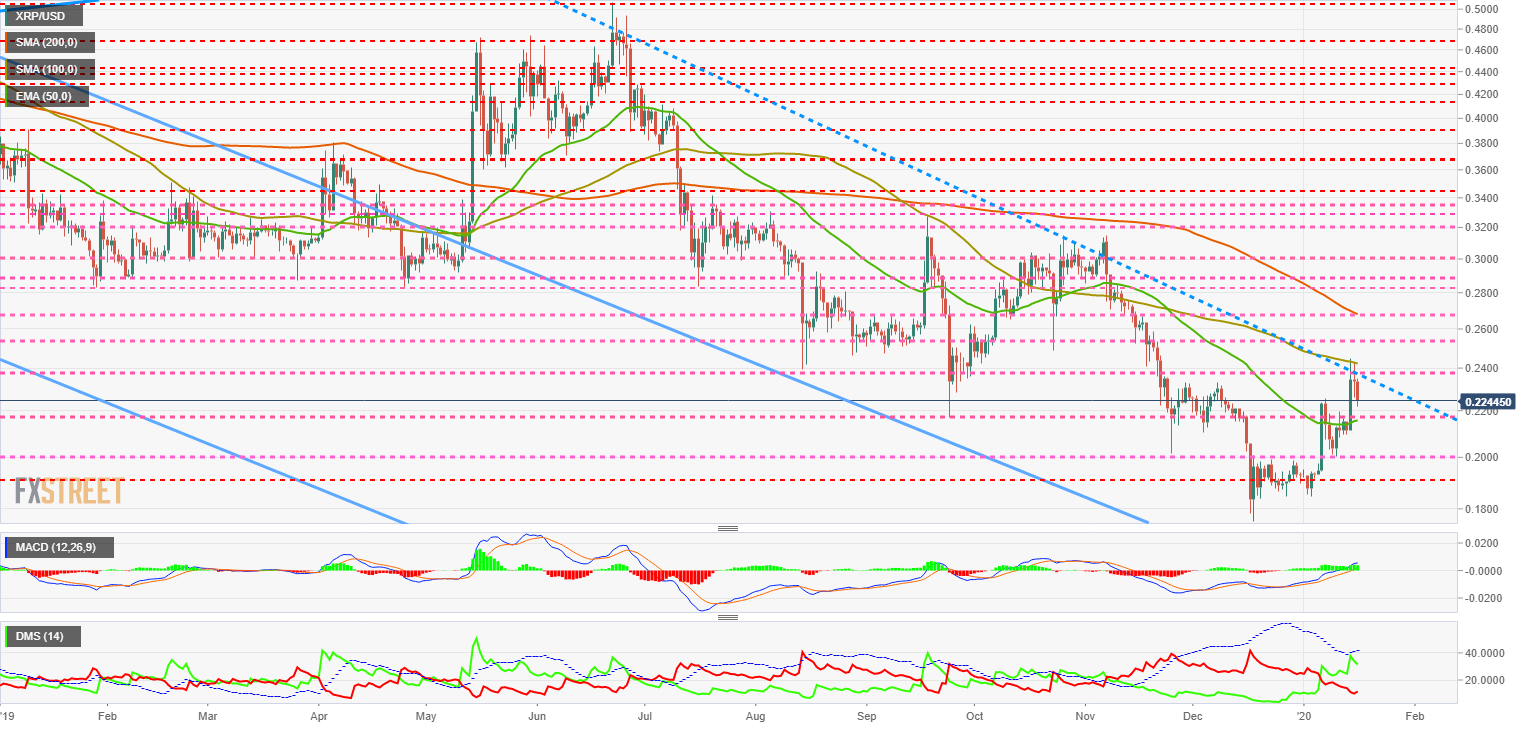 The MACD indicator on the daily chart has completed its crossover into the bullish channel and retains both the slope and the line separation. The short term forecast is for continued upward movement.
The DMI on the daily chart shows that there is a problem with the bulls. The difficulty in breaking the ADX line upwards indicates that the buying side still needs more support to gain control which it does not have now despite the advantage over the bears.
Get 24/7 Crypto updates in our social media channels: Give us a follow at @FXSCrypto and our FXStreet Crypto Trading Telegram channel
Information on these pages contains forward-looking statements that involve risks and uncertainties. Markets and instruments profiled on this page are for informational purposes only and should not in any way come across as a recommendation to buy or sell in these assets. You should do your own thorough research before making any investment decisions. FXStreet does not in any way guarantee that this information is free from mistakes, errors, or material misstatements. It also does not guarantee that this information is of a timely nature. Investing in Open Markets involves a great deal of risk, including the loss of all or a portion of your investment, as well as emotional distress. All risks, losses and costs associated with investing, including total loss of principal, are your responsibility. The views and opinions expressed in this article are those of the authors and do not necessarily reflect the official policy or position of FXStreet nor its advertisers. The author will not be held responsible for information that is found at the end of links posted on this page.
If not otherwise explicitly mentioned in the body of the article, at the time of writing, the author has no position in any stock mentioned in this article and no business relationship with any company mentioned. The author has not received compensation for writing this article, other than from FXStreet.
FXStreet and the author do not provide personalized recommendations. The author makes no representations as to the accuracy, completeness, or suitability of this information. FXStreet and the author will not be liable for any errors, omissions or any losses, injuries or damages arising from this information and its display or use. Errors and omissions excepted.
The author and FXStreet are not registered investment advisors and nothing in this article is intended to be investment advice.
Recommended Content
Editors’ Picks
PENDLE price soars 10% after Arthur Hayes’ optimism on Pendle derivative exchange

Pendle (PENDLE) price is among the top performers in the cryptocurrency market today, posting double-digit gains. Its peers in the altcoin space are not as forthcoming even as the market enjoys bullish sentiment inspired by Bitcoin (BTC) price.
Ethereum shows signs of a potential rally as suspected Justin Sun wallet buys heavily

Ethereum's (ETH) recent price movement hints at a potential rally despite ETH ETPs recording outflows. The recent price improvement follows the fourth Bitcoin halving and a suspected Justin Sun wallet purchasing large numbers of ETH.
Floki poised for growth after listing on Revolut
Floki's (FLOKI) team announced in an X post on Monday that the meme coin would be listed on the popular neobank and Fintech platform Revolut. Floki could rise further following key partnerships to boost retail usage.
Jupiter DEX second Launchpad vote concludes, JUP price rises 5%

Jupiter, a Solana-based decentralized exchange (DEX) has completed the second launchpad (LFG) vote to identify the two projects that will debut on its platform. On March 30, the aggregator network had unveiled its Core Working Group (CWG) budget proposal voting.
Bitcoin: BTC post-halving rally could be partially priced in Premium

Bitcoin (BTC) price briefly slipped below the $60,000 level for the last three days, attracting buyers in this area as the fourth BTC halving is due in a few hours. Is the halving priced in for Bitcoin? Or will the pioneer crypto note more gains in the coming days?