Top 3 Price Prediction Bitcoin, Ethereum, Ripple: Ethereum breathes before shooting up the all-time highs
- Ethereum leads an effervescent altcoin segment in search of its golden moment.
- It is time for Bitcoin to take it easy after the impressive show of force.
- XRP is immersed in a game of intrigue, interests and opportunities.

The BTC/USD pair is up over $30,000 after yesterday's drop of 20% to $27,000.
There is anxiety to buy Bitcoin in the market and the options to buy at a discount are short-lived as investors are eager to get hold of the increasingly scarce Bitcoin.

The Bitcoin Dominance chart shows the result, closing the day inside the bullish channel. A close below the 67.5 level of dominance would trigger a downward leg with a first target at the 66 levels, as projected by the MACD downward cross. We cannot rule out a walkout to the 62 levels where the 200-day simple moving average sits. Who would benefit from this move? The altcoin segment in general, but especially Ethereum.
ETH/BTC daily chart
The ETH/BTC pair is currently trading at the price level of 0.0327. The session's peak has been set at 0.035, but more importantly, it has ended the correction that began at the relative highs of September 1st. The 200-day moving average accompanies the pair perfectly and also crosses into the new bullish scenario, giving solidity to the movement.
Above the current price, the first resistance level is at 0.0332, then the second at 0.035 and the third at 0.0371.
Below the current price, the first support level is at 0.0316, then the second at 0.0305 and the third one at 0.0293.
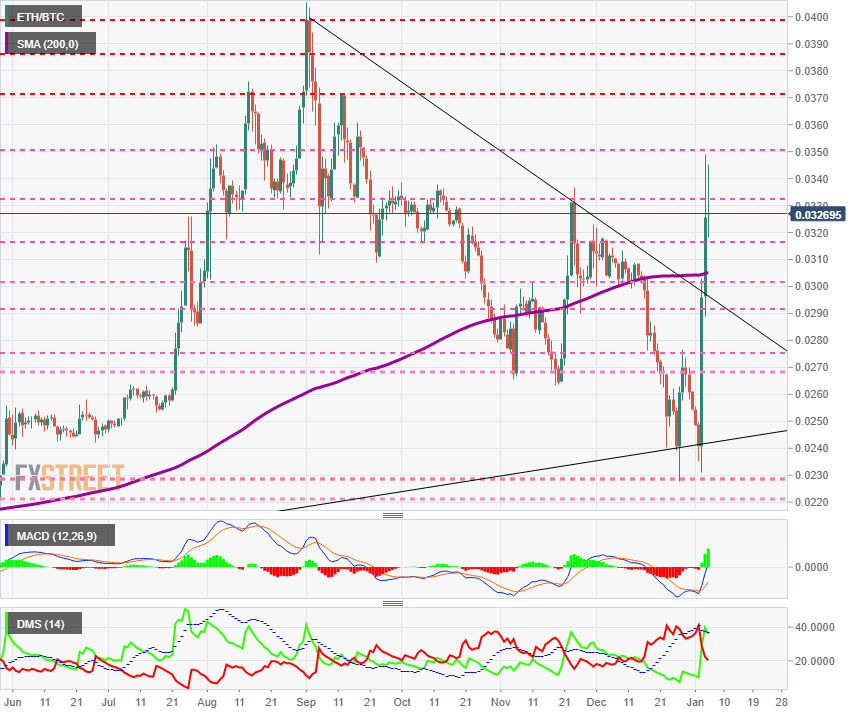
The MACD on the daily chart takes on a radical bullish profile, so extreme that it poses a polarized scenario between the bullish explosion and the technical correction that returns the moving averages to more normal inclinations.
The DMI on the daily chart shows bulls above the ADX line, which usually provides a strong signal for the upward movement. On the other hand, bears continue to lose strength and show no intention of competing for the direction of the ETH/BTC pair.
BTC/USD daily chart
The BTC/USD pair is currently trading at $31,600 following an intraday correction that brought the price up to $28,000, where the money quickly showed up.
Above the current price, the first resistance level is at $33,370, then the second at $34,799. Above this level, the BTC/USD would again enter a free ride mode targeting the moon.
Below the current price, the first support level is at $28,000, then the second at $26,514 and the third one at $23,950.

The MACD on the daily chart is showing a loss of the upside profile but retains the separation between the moving averages, leaving room for possible upward extensions.
The DMI on the daily chart shows bulls losing strength but still retaining a considerable advantage over the market's buy-side. The bears are pausing in their upward trajectory but are not giving up their attempt to control the BTC/USD pair.
ETH/USD daily chart
The ETH/USD pair is currently trading at $1,036. All eyes are on the historic high of $1,400, but we should not ignore the danger warning provided by the 200-day simple moving average, which is located in the $440 zone, well below the current price.
ETH/USD needs to rise with some speed to pull this moving average up and provide reliable support.
Above the current price, the first resistance level is $1,145, then the second at $1,215 and the third at $1,291.
Below the current price, the first support level is at $975, then the second at $885 and the third one at $815.
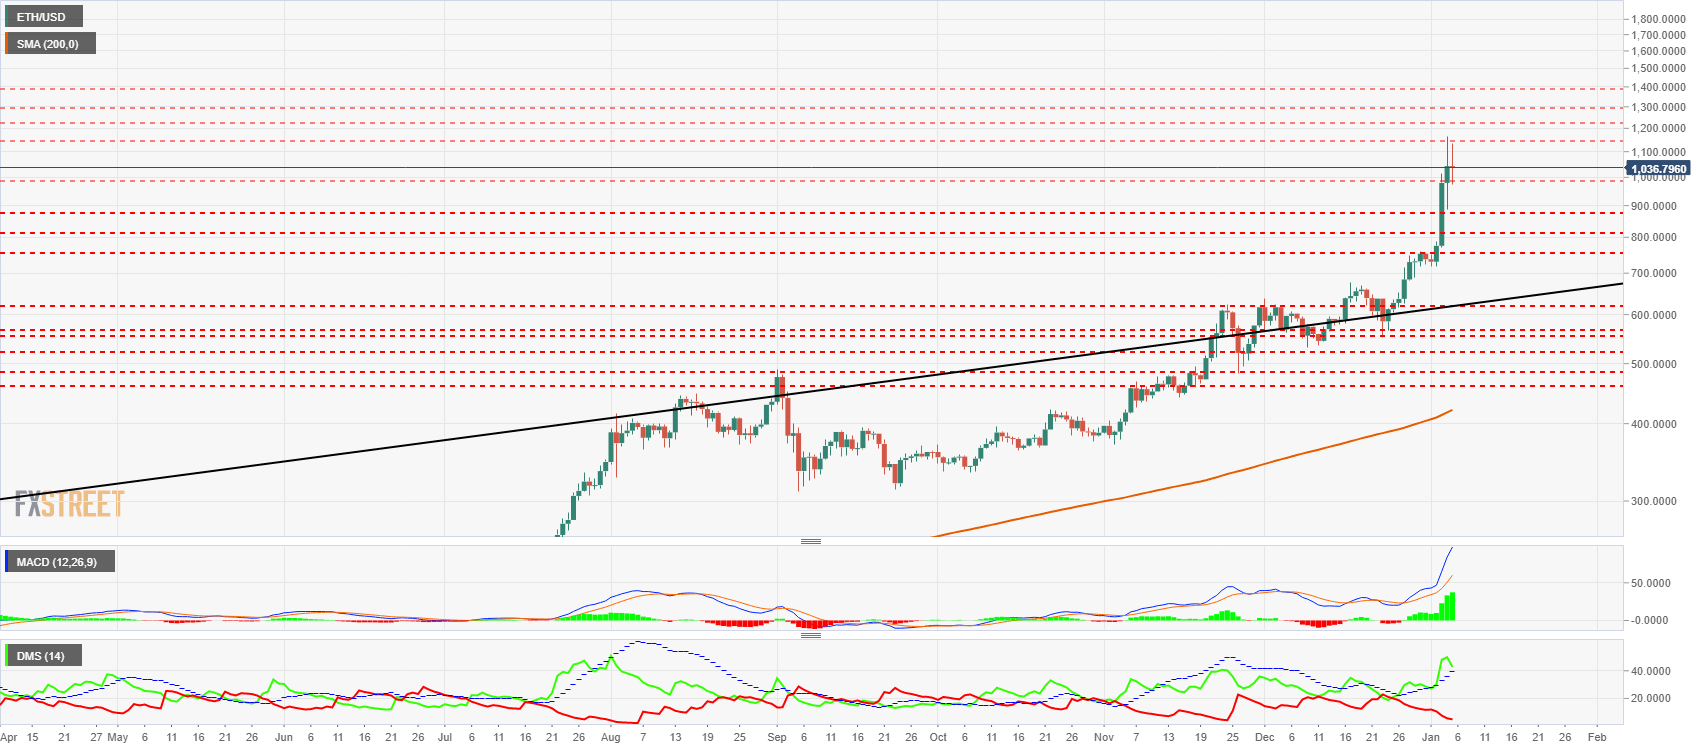
The MACD on the daily chart shows a radically upward profile in terms of slope and line spacing. The current structure indicates an increase in volatility, with possible violent – but temporary – price reversals.
The DMI on the daily chart shows bulls losing strength but retaining an overwhelming advantage over clearly bearish bears.
XRP/USD daily chart
The XRP/USD pair is currently trading at the price level of $0.2339 as the game is played in meeting rooms, regulators' offices and courts. I have always argued that Ripple Ltd was financed by selling XRP and should be considered as equity. I do not see this process as a risk to XRP holders, as long as the ratio of change from XRP token to XRP share is appropriate.
The 200-day simple moving average is at the $0.30 price level, a feasible goal in the short term.
Above the current price, the first resistance level is at $0.261, then the second at $0.30 and the third at $0.315.
Below the current price, the first support level is at $0.228, then the second at $0.201 and the third one at $0.168.
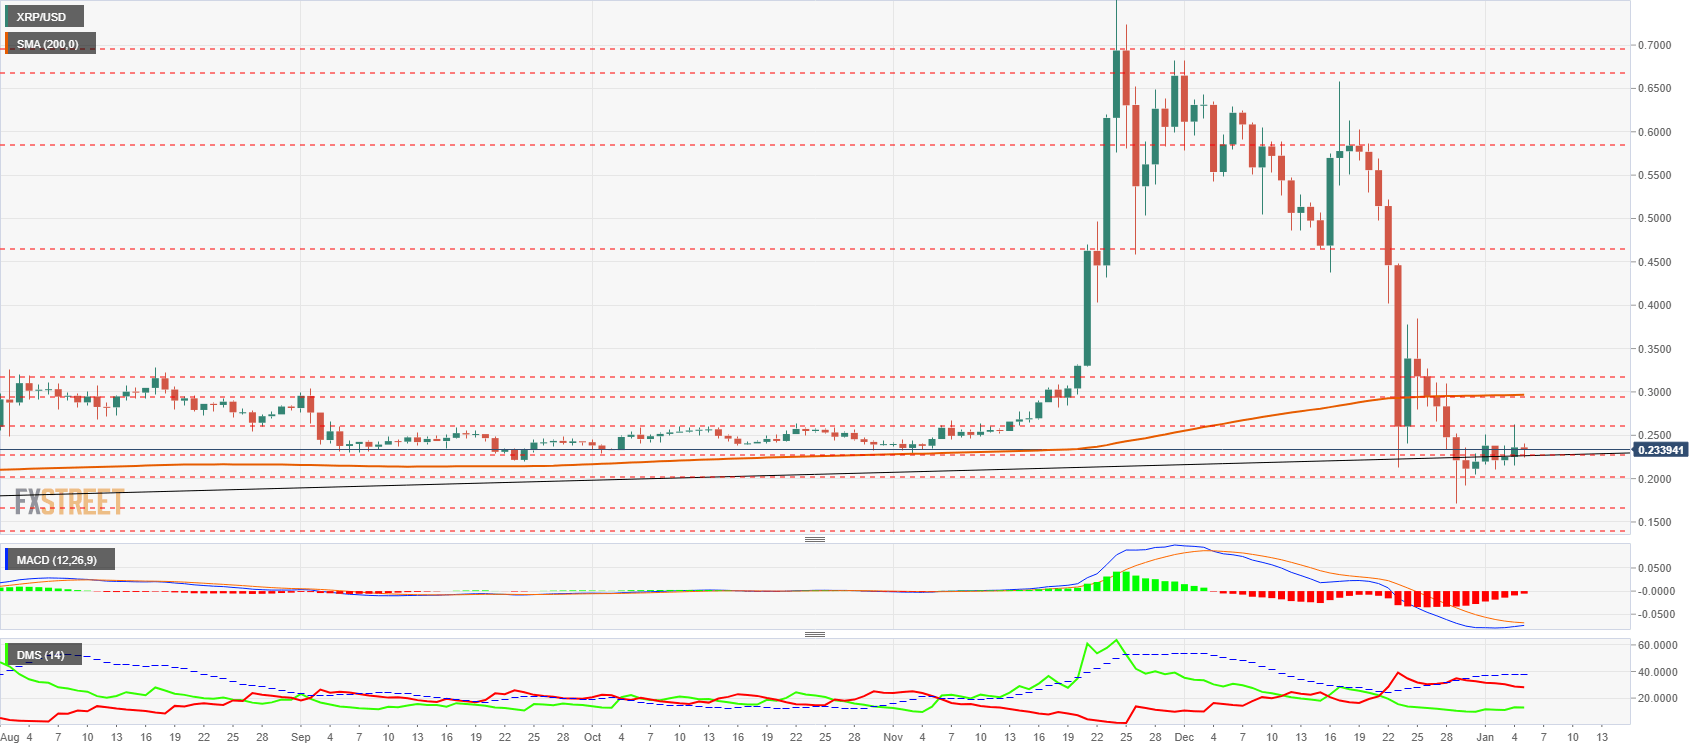
The MACD on the daily chart shows an optimal position for an upward cross to occur in the short term. This technical event will allow us to properly assess the technical condition of the XRP/USD pair.
The DMI on the daily chart shows bears maintaining control of the pair despite a slight drop in strength, which bulls use to recover after the sell-off.
Author

Tomas Salles
FXStreet
Tomàs Sallés was born in Barcelona in 1972, he is a certified technical analyst after having completing specialized courses in Spain and Switzerland. He expanded his technical training following the guidance of great experts on the financial markets.