TOP 3 price prediction Bitcoin, Ethereum, Ripple: Doing the right thing
-
BTC/USD adjusting the speed of its movement to avoid past errors, targeting $8,344
-
ETH/USD validates moving averages, targets $617
-
XRP/USD needs more time to digest the change of trend, targets $0.63

A market that does not learn from its mistakes is a market with no future. And Blockchain technology owns the future. After a return to the double-digit percentage rises, Crypto market looks to settle down, looking at the longer term. Today’s consolidation sets up tomorrow’s supports and, although it probably unnerves the Crypto bulls, it is necessary for a healthy long-term bullish ride.
BTC/USD 240 Min
Bitcoin is trading at $7,300 on the European opening in what looks to be a quiet trading day, at least until the opening of the US market. The indicators show a pattern of consolidation before another upward movement which could add considerable volatility.
On the bullish side: The signal for another bullish segment would be a close above $7,400 which should be secured with a stop below $7,200. The BTC/USD movement would not gain strength until above $7,600, with a first target at $7,873 and a second target level at $8,344.
On the downside: First support at $7,100, a price level that is now the difference between a momentum bullish price of a momentum bearish for the BTC/USD. If lost, return to a bearish scenario and consequently search for lower levels, first target at $6,850. Second target at $6,768.
Click to see the Full Customized Chart
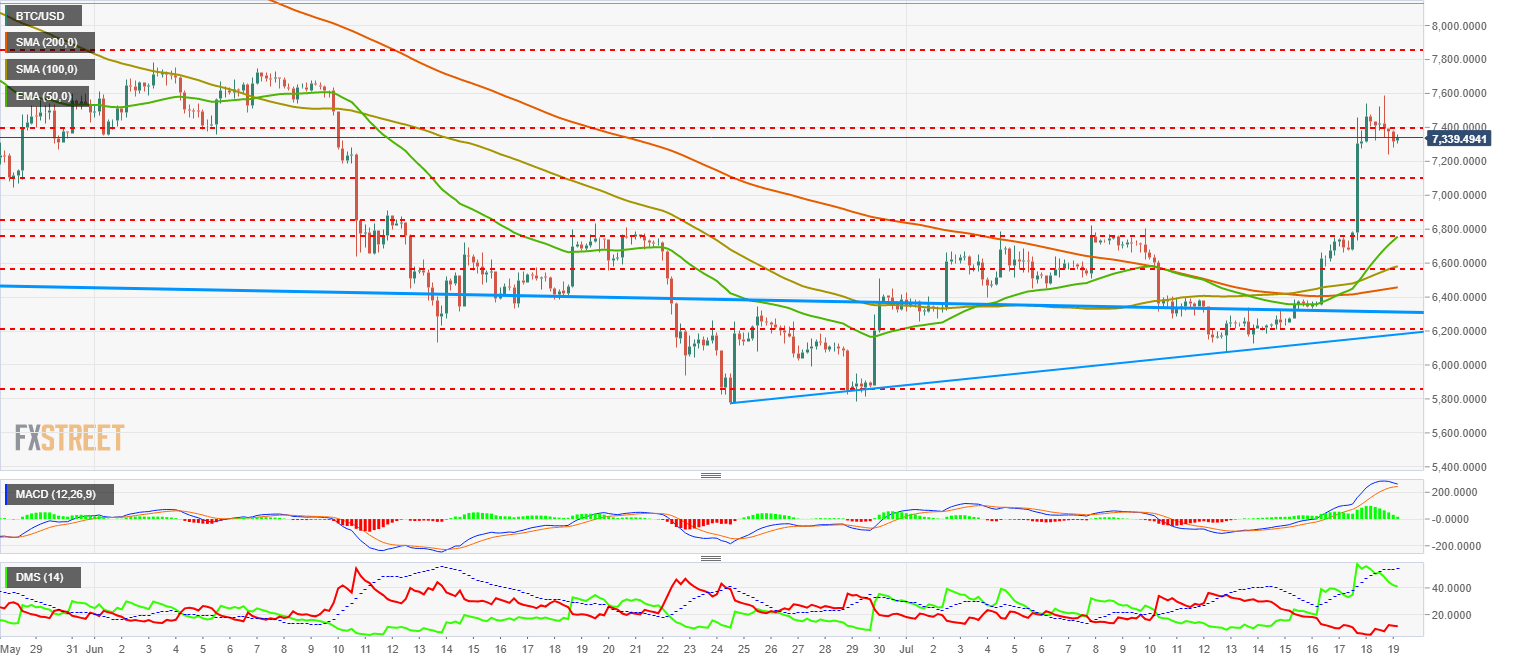
MACD at 240 Min is now about to cross the signal line downwards, so an upward movement caused by the first rejection of the MACD cut is quite likely.
The Directional Movement Index shows buyers who still at high levels, despite having decreased their activity. Sellers don't believe in the dip at all and have kept a very low level of activity. Despite this, the wide difference between the two indicators will tend to decrease, either due to a decrease in the buyers' activity or due to an increase in sellers' activity. The ADX continues to signal a strong trend.
ETH/USD 240 Min
ETH/USD has validated the previous upward movement by going down to the moving averages. Its technical development is more advanced because it has gotten to new territories faster in its attempt to reach $520.
On the upside: First clear target for Ethereum to recover the $485 level, where buy-side positions could be opened with a stop one point below the current consolidation low. Second target at $520 as an intermediate level before an attack to the main technical targets, the first of these targets is at $568 and the next at $617.
On the downside: The critical level for ETH/USD is marked by moving average levels. Below $460, it would open the bearish scenario again in all periods. Until that level is reached, Ethereum should find support at $467. If both supports are lost, ETH/USD would have a clear target at $435.
Click to see the Full Customized Chart
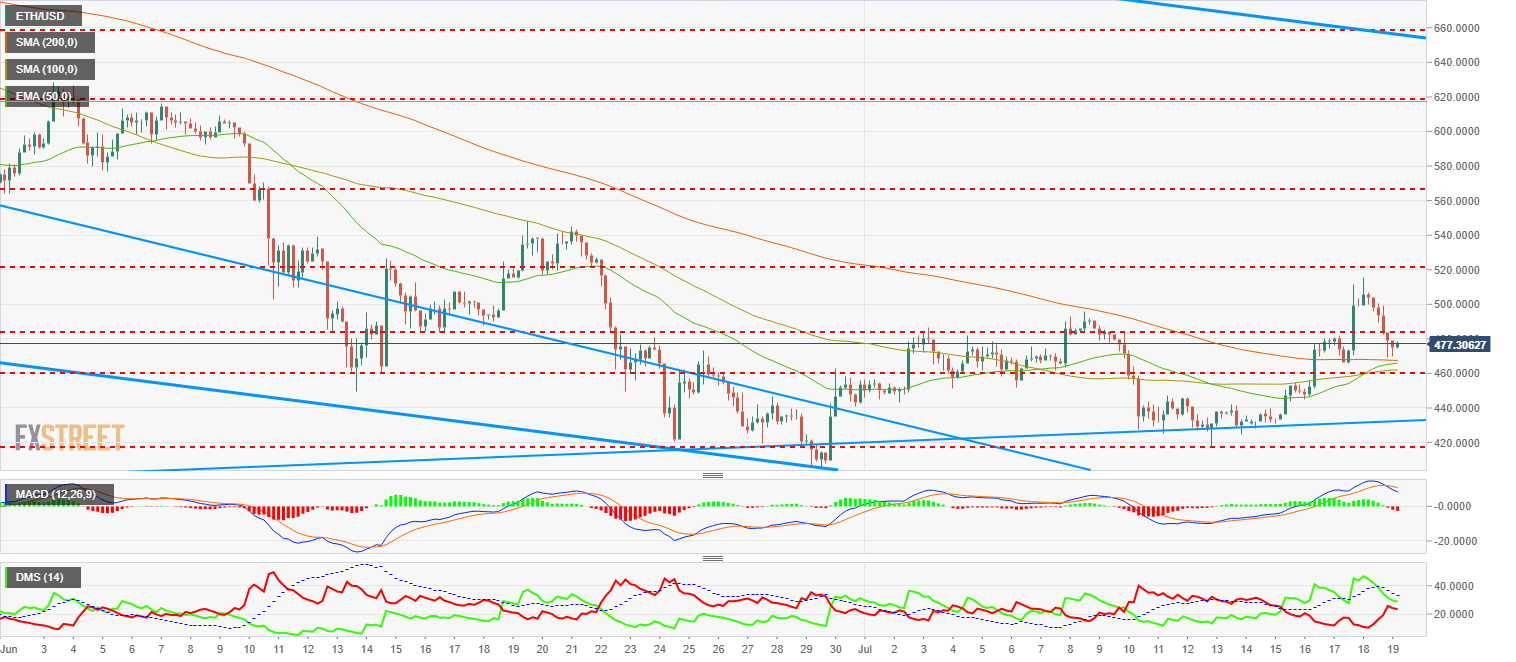
MACD at 240 Min appears to be fully crossed downwards. Likely upward movement for Ethereum from the opening of the American market by testing the signal line from the downside.
The Directional Movement Index shows sellers and buyers at close quarters but with a clear advantage for bullish traders. More confident than in the case of Bitcoin on the part of the sell-side, possibly attracted by the recent attacks that are complicating the future of ETH/USD.
XRP/USD 240 Min
Ripple was not able to close above $0.52 and that led him to the first support he had available, right at $0.48. Its structure is similar to the one of Ethereum and the considerations are also similar.
On the bullish side: First clear target for Ripple to regain the $0.504 level. Possible bullish entry point with the stop below $0.50, although I would rather wait for a close above $0.52 with a stop below $0.504. Next bullish target for the XRP/USD at $0.554, then move towards the $0.63 level as the main target of the move.
On the downside: Ripple will continue to be bullish as long as it does not close below the $0.466 level. If it loses this level, the first downward target is $0.44, followed by the June low of $0.424.
Click to see the Full Customized Chart
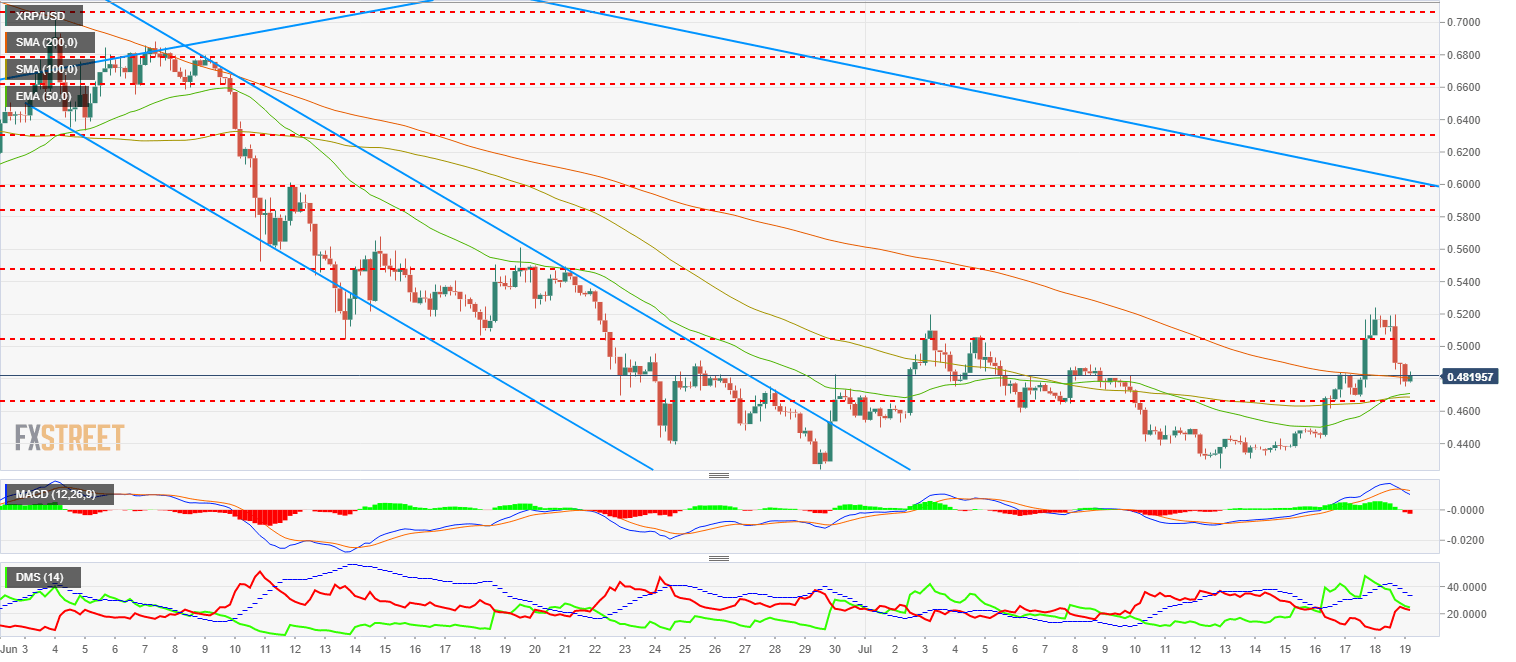
MACD is cut to the downside with a less advanced technical development than in the case of the Ethereum. It is possible that Ripple followed a possible upward movement, but should not have much of an upward path.
DMI shows in the Ripple chart almost a tie, although buyers have a slight advantage over sellers.
Author

Tomas Salles
FXStreet
Tomàs Sallés was born in Barcelona in 1972, he is a certified technical analyst after having completing specialized courses in Spain and Switzerland. He expanded his technical training following the guidance of great experts on the financial markets.


