Top 3 Price Prediction Bitcoin, Ethereum, Ripple: Crypto market turns to Bitcoin for directionlessness
- Dominance graphs show potential in Bitcoin to take 3/4 of the market.
- Ethereum shows uncertainty just a few cents from key resistance levels.
- Ripple takes the concept of low volatility to the next level, far from what the market expected from XRP.

Tranquillity dominates the crypto board in the last hours, where no significant changes since Friday's session.
US employment data came in as a positive surprise and calmed sentiment, resulting in Gold sales and some easing of upward pressure on the Bitcoin.
The public debate these days is whether the market has reached the end of this uptrend or whether the price still has some way to go.
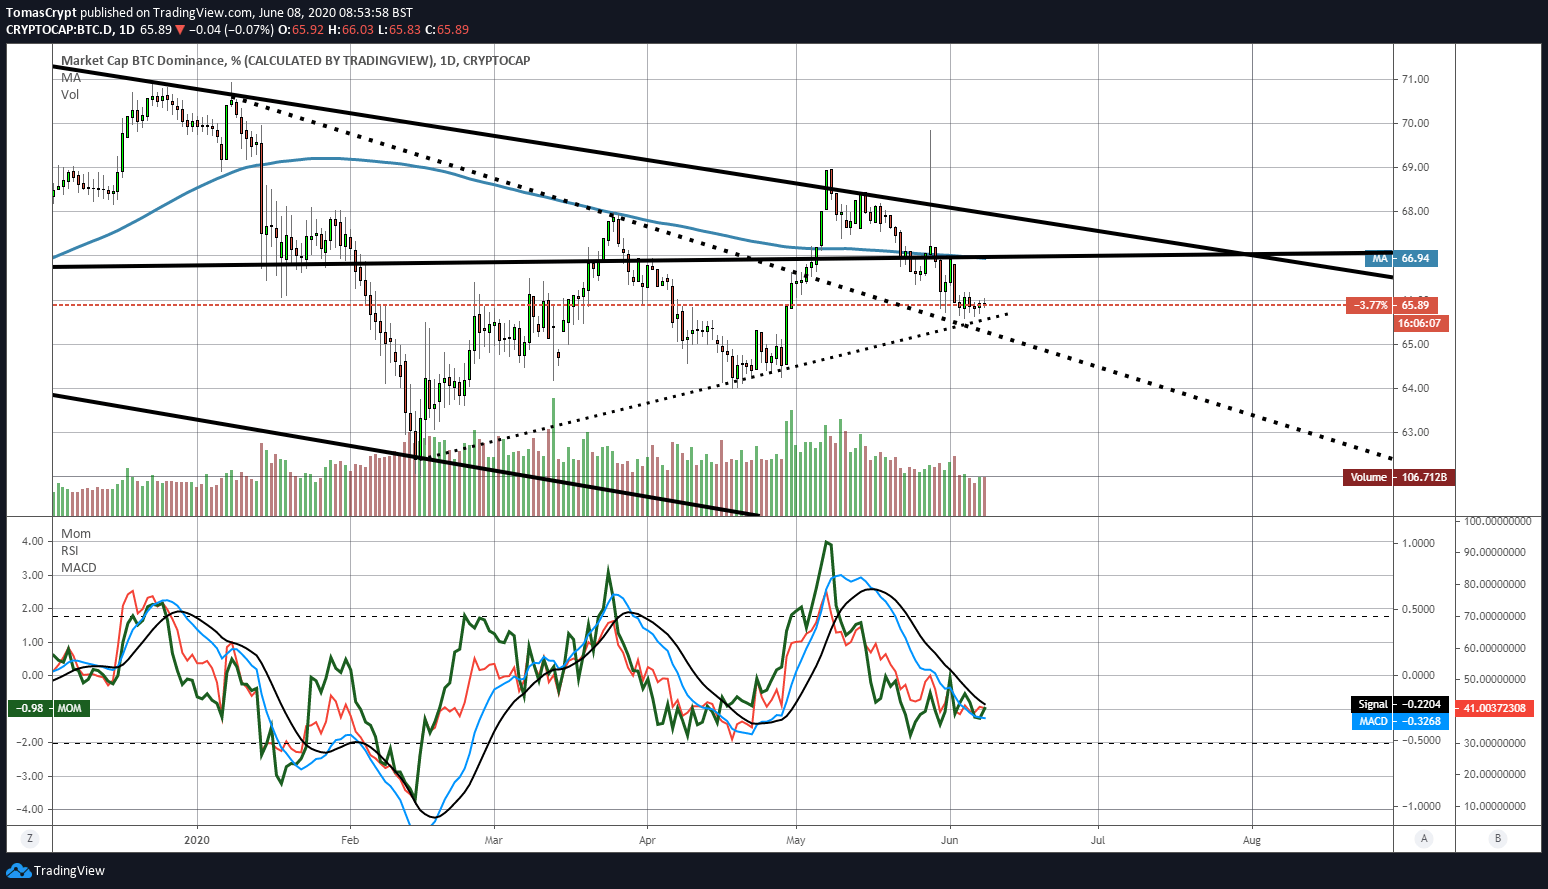
The pause in the price comes when the dominance charts face key levels, especially in the case of Bitcoin.
The daily Bitcoin dominance chart shows the critical support level at which it is consolidating, just above the 65.5% level.
Technical indicators tend to look for an upward swing profile that would put a possible upward breakout on the table that could take the Bitcoin market share above 70%.
Ethereum, on the other hand, is moving within a few points of the significant downward resistance level.
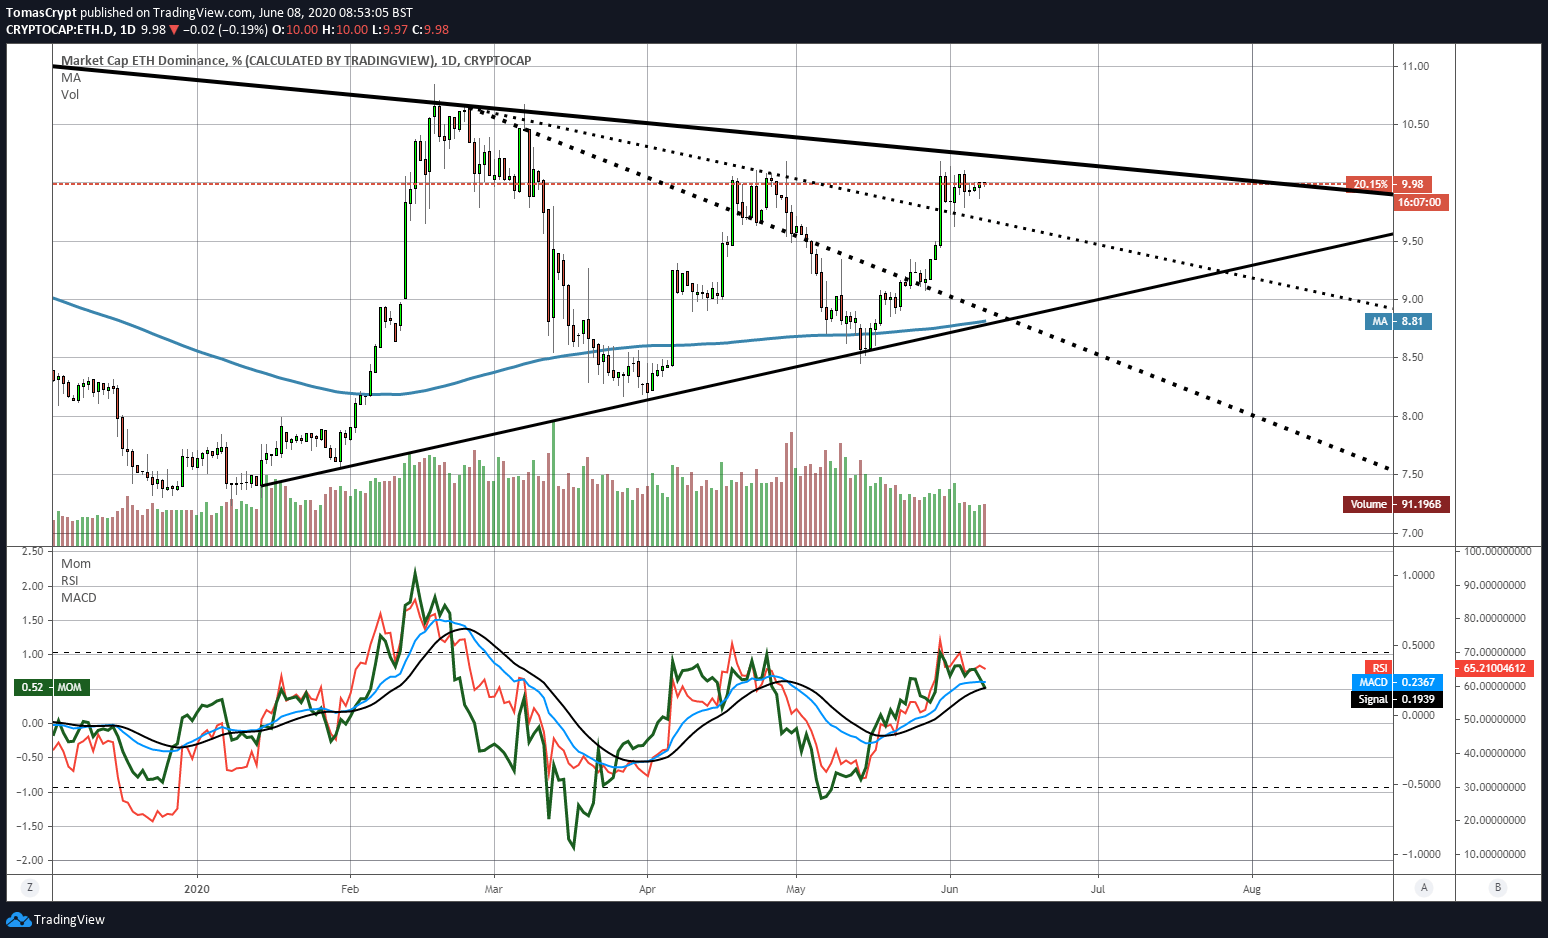
The 10% market share level is proving to be a formidable resistance, so much so that it is bending the indicators and proposing declines in the coming days. The primary targets for a possible downtrend are the dominance level of 9.5% first and then 9.0%.
ETH/BTC Daily Chart
The ETH/BTC pair is currently trading at the price level of 0.02505 as it continues to compress between the price congestion support at 0.0248 and the bearish trend line at 0.0254.
Above the current price, the first resistance level is at 0.0254, then the second at 0.026 and the third one at 0.0276.
Below the current price, the first support level is at 0.0248, then the second at 0.0235 and the third one at 0.0225.
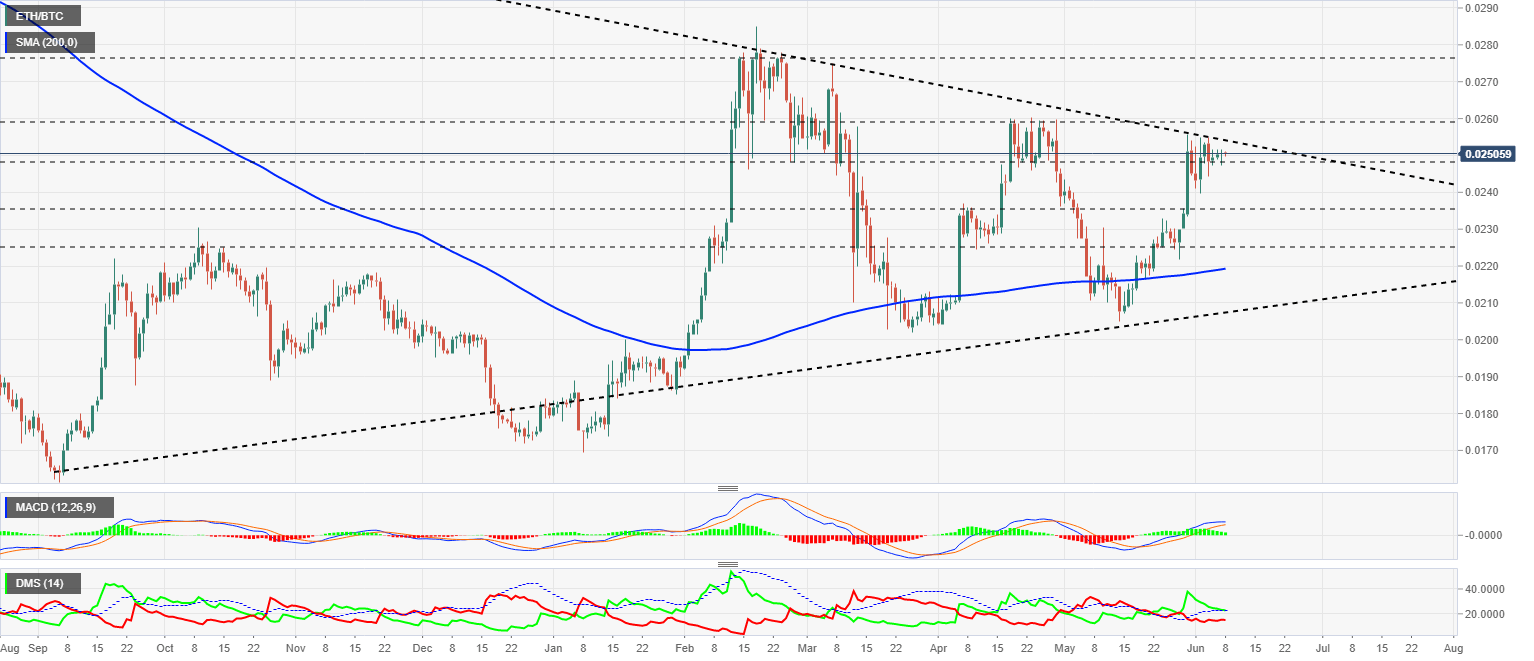
The MACD on the daily chart shows the loss complete the bullish trend and moving to a side structure with options for a final upward attempt.
The DMI on the daily chart shows bulls trying to find support at the ADX line, while bears show little interest in increasing their activity.
BTC/USD Daily Chart
The BTC/USD pair is currently trading at the $9733 price level while keeping many traders on edge by not showing much interest in going above the $10000 level. The four-zero level has more symbolic than technical significance, as the first significant resistance to broke is at $10500.
Above the current price, the first resistance level is at $10500, then the second at $11365 and the third one at $12850.
Below the current price, the first support level is at $9500, then the second at $9225 and the third one at $8750.
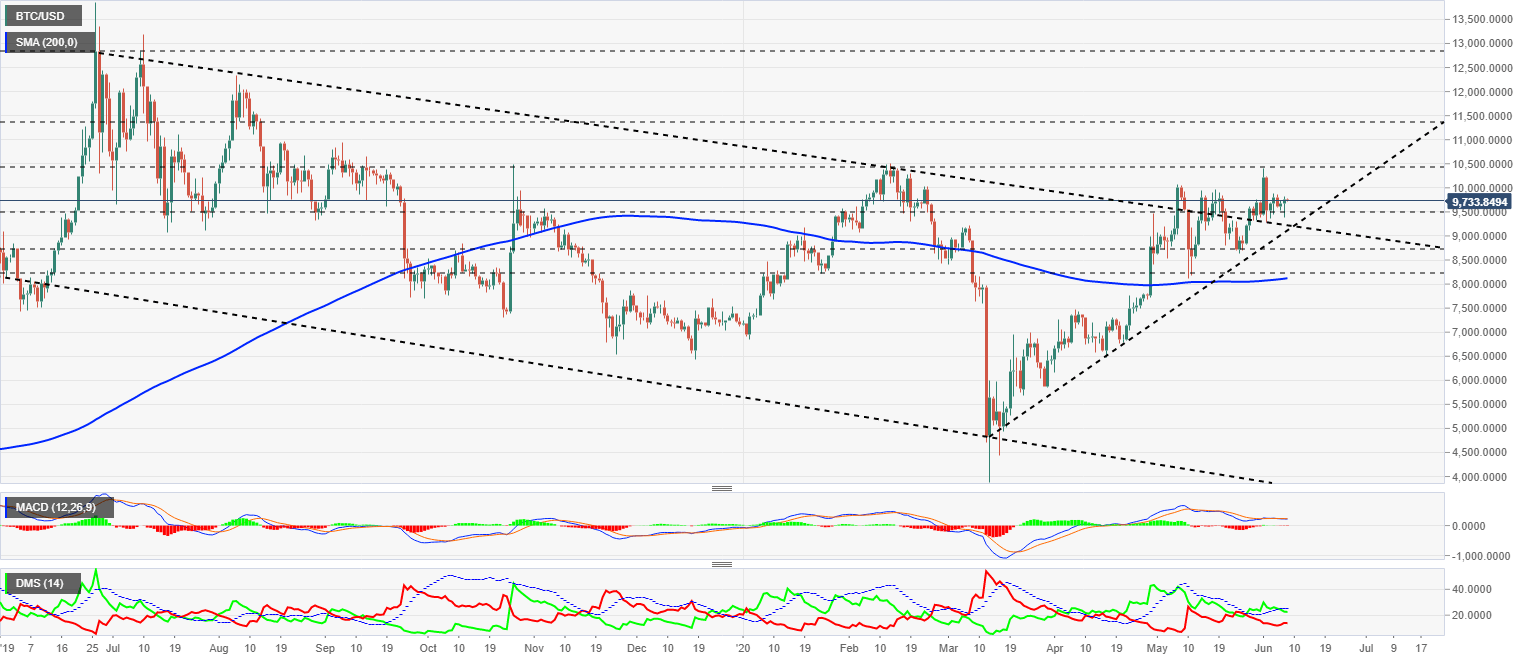
The MACD on the daily chart continues to show an unusual horizontal profile one more day, which due to the height at which it is forming could cause a price shock when it breaks down, in any direction.
The DMI on the daily chart shows the bulls losing support from the ADX line, an event that deactivates the bullish pattern. The bears react quickly to the bullish strength lost and could fight for the leadership position in the pair.
ETH/USD Daily Chart
The ETH/USD pair is currently trading at $244. The buying side has given up trying to break the price congestion resistance level at $250, bad news when the primary downward trend line is at the $260 price level.
Above the current price, the first resistance level is at $250, then the second at $260 and the third one at $290.
Below the current price, the first support level is at $235, then the second at $222 and the third one at $200.
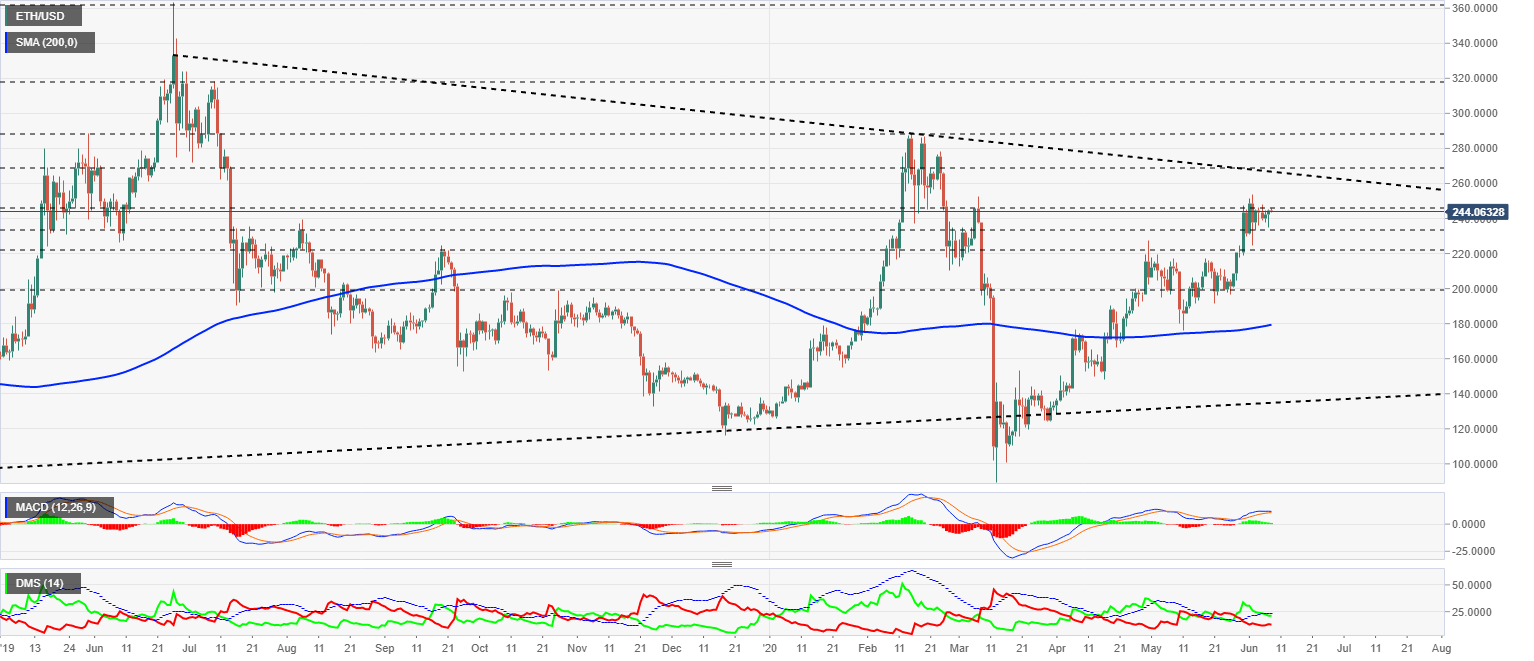
The MACD on the daily chart shows a bearish cross in development, which could complete in the next few hours.
The DMI on the daily chart shows bulls losing support from the ADX line, which disables the bullish pattern and gives way to a bearish lateral phase with increased volatility.
XRP/USD Daily Chart
The XRP/USD pair is currently trading at the price level of $0.2027. The low volatility is extreme so that a violent exit from the current situation is very high. There is no information about the direction of the price in the short or medium term.
Above the current price, the first resistance level is at $0.213, then the second at $0.234 and the third one at $0.262.
Below the current price, the first support level is at $0.20, then the second at $0.185 and the third one at $0.165.
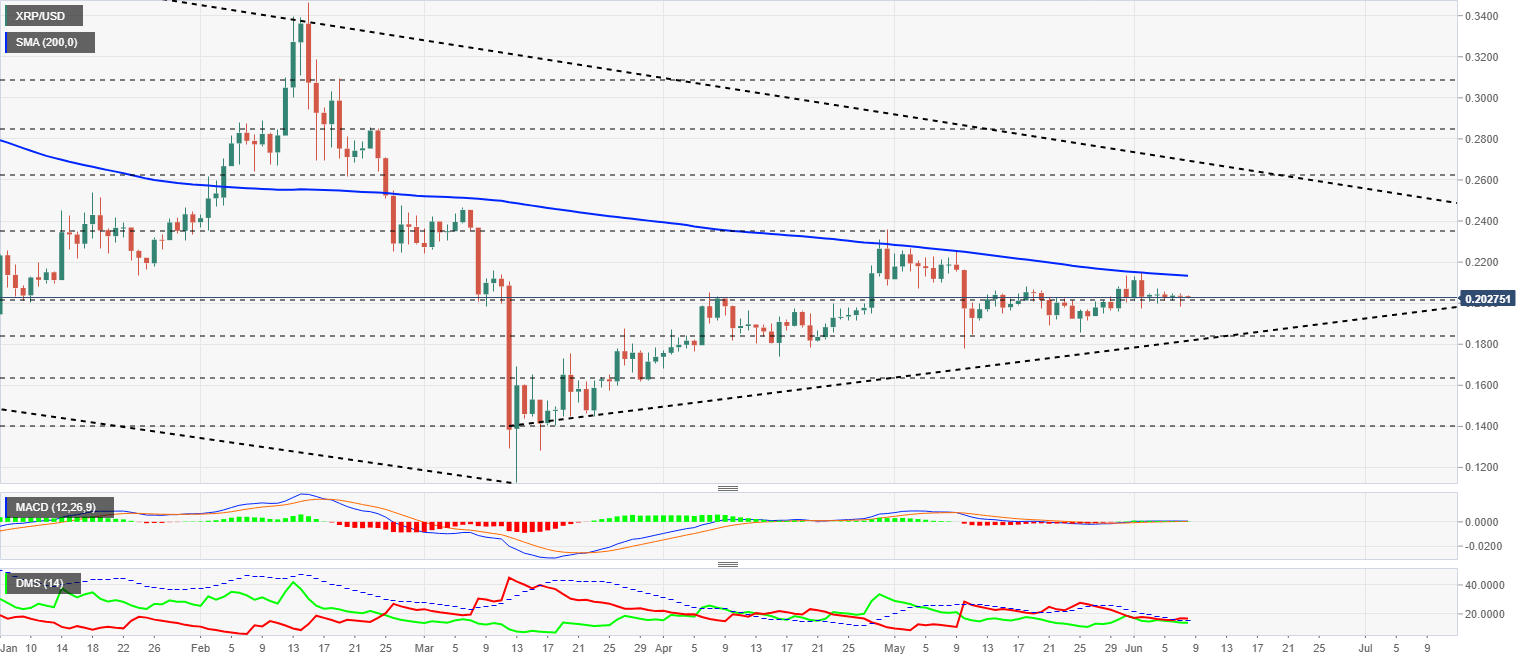
The MACD on the daily chart shows a flat profile that reflects the absolute lack of direction in the XRP/USD pair.
The DMI on the daily chart shows the bears crossing the ADX line, which would trigger a bearish pattern in the price in the short term. The bulls are staying very close to the bears, which could limit the price drops.
Author

Tomas Salles
FXStreet
Tomàs Sallés was born in Barcelona in 1972, he is a certified technical analyst after having completing specialized courses in Spain and Switzerland. He expanded his technical training following the guidance of great experts on the financial markets.


