XRP extends short-term recovery despite cooling retail demand
- XRP gains momentum, trading above $1.07 on Thursday, raising odds for a short-term breakout to $1.20.
- XRP shows a short-term recovery bias despite sustained spot ETF outflows and a persistent drawdown in futures Open Interest.
- XRP’s technical momentum indicators are showing early signs of strengthening, as the RSI rises toward its midline and the MACD upholds a bullish crossover.

Ripple (XRP) grinds higher on Thursday, trading above $1.07. This comes after the remittance token tested support at $1.03 amid heavy selling pressure that has dominated the crypto market in recent weeks.
Investors are showing fresh interest in risk assets amid reports that the just-concluded talks between the United States (US) and Iran yielded “positive progress” in Doha. According to Qatari mediators, progress was made on issues related to the Memorandum of Understanding (MoU), and both parties agreed to continue discussions.
XRP sustains capital outflows
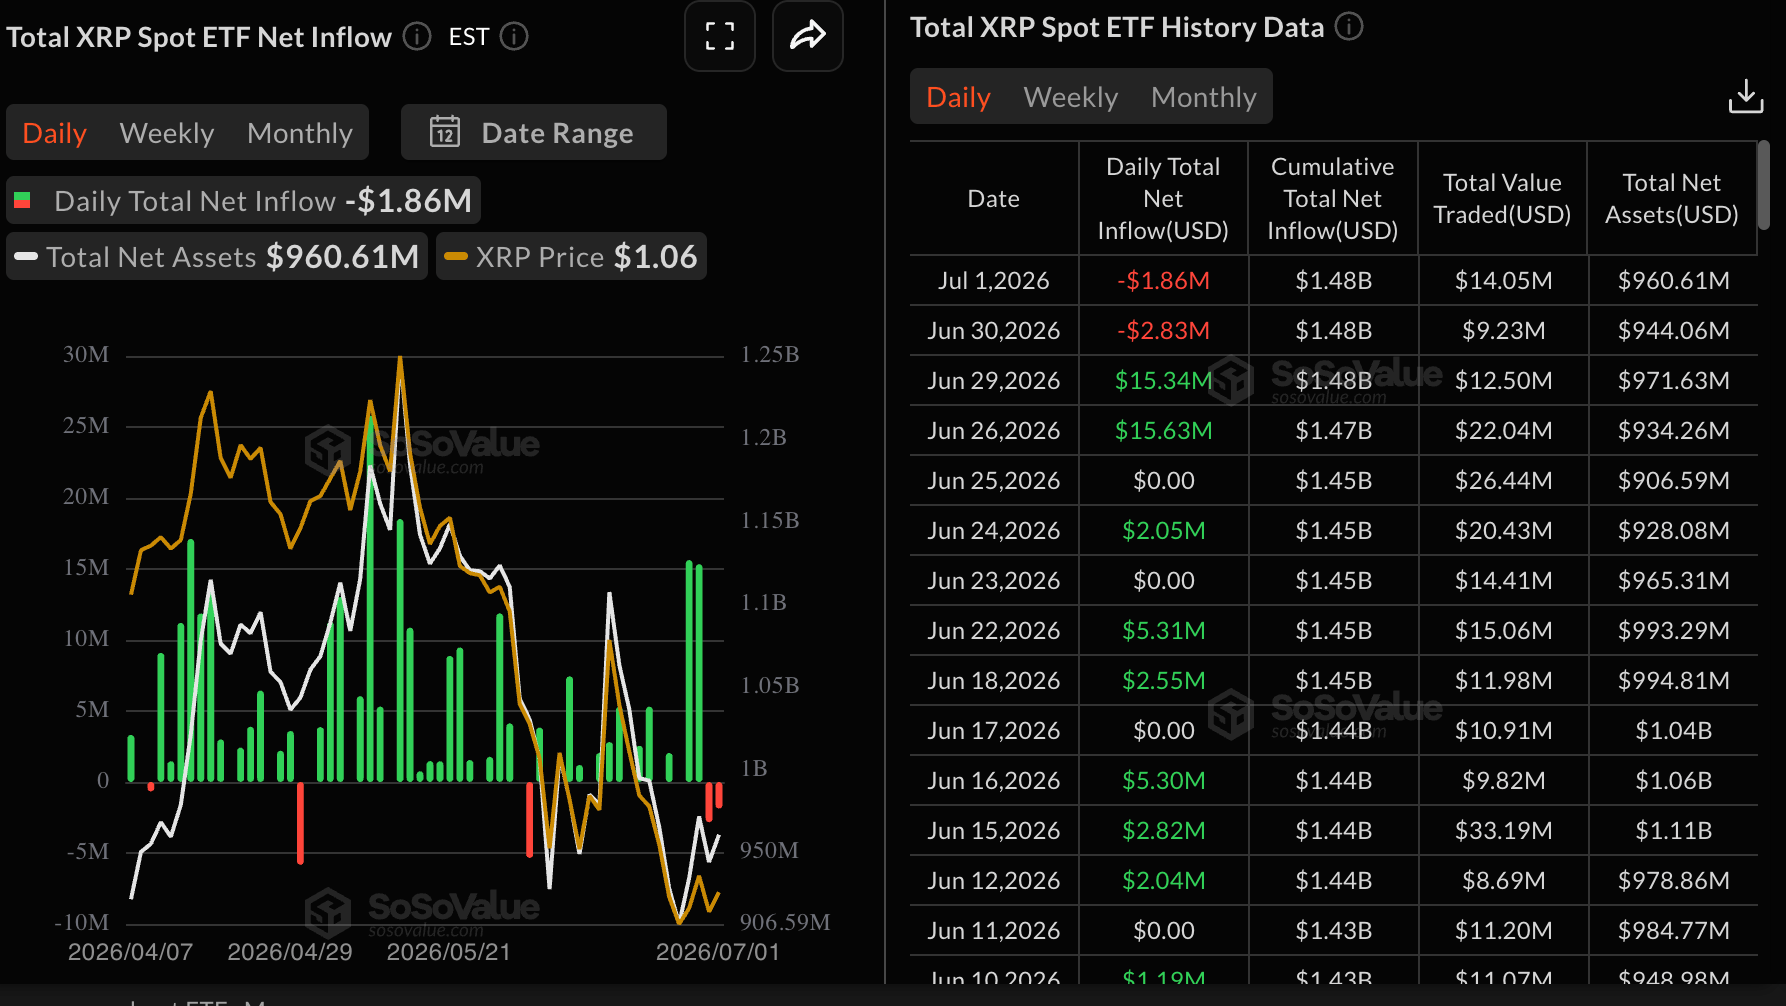
Institutional interest in XRP remains on the back foot, as evidenced by a two-day bearish streak. SoSoValue data show nearly $2 million in mild outflows on Wednesday, following roughly $3 million on Tuesday. Sustained outflow suggests that risk-averse sentiment is dominant, which may cap XRP’s ongoing rebound in the short term.
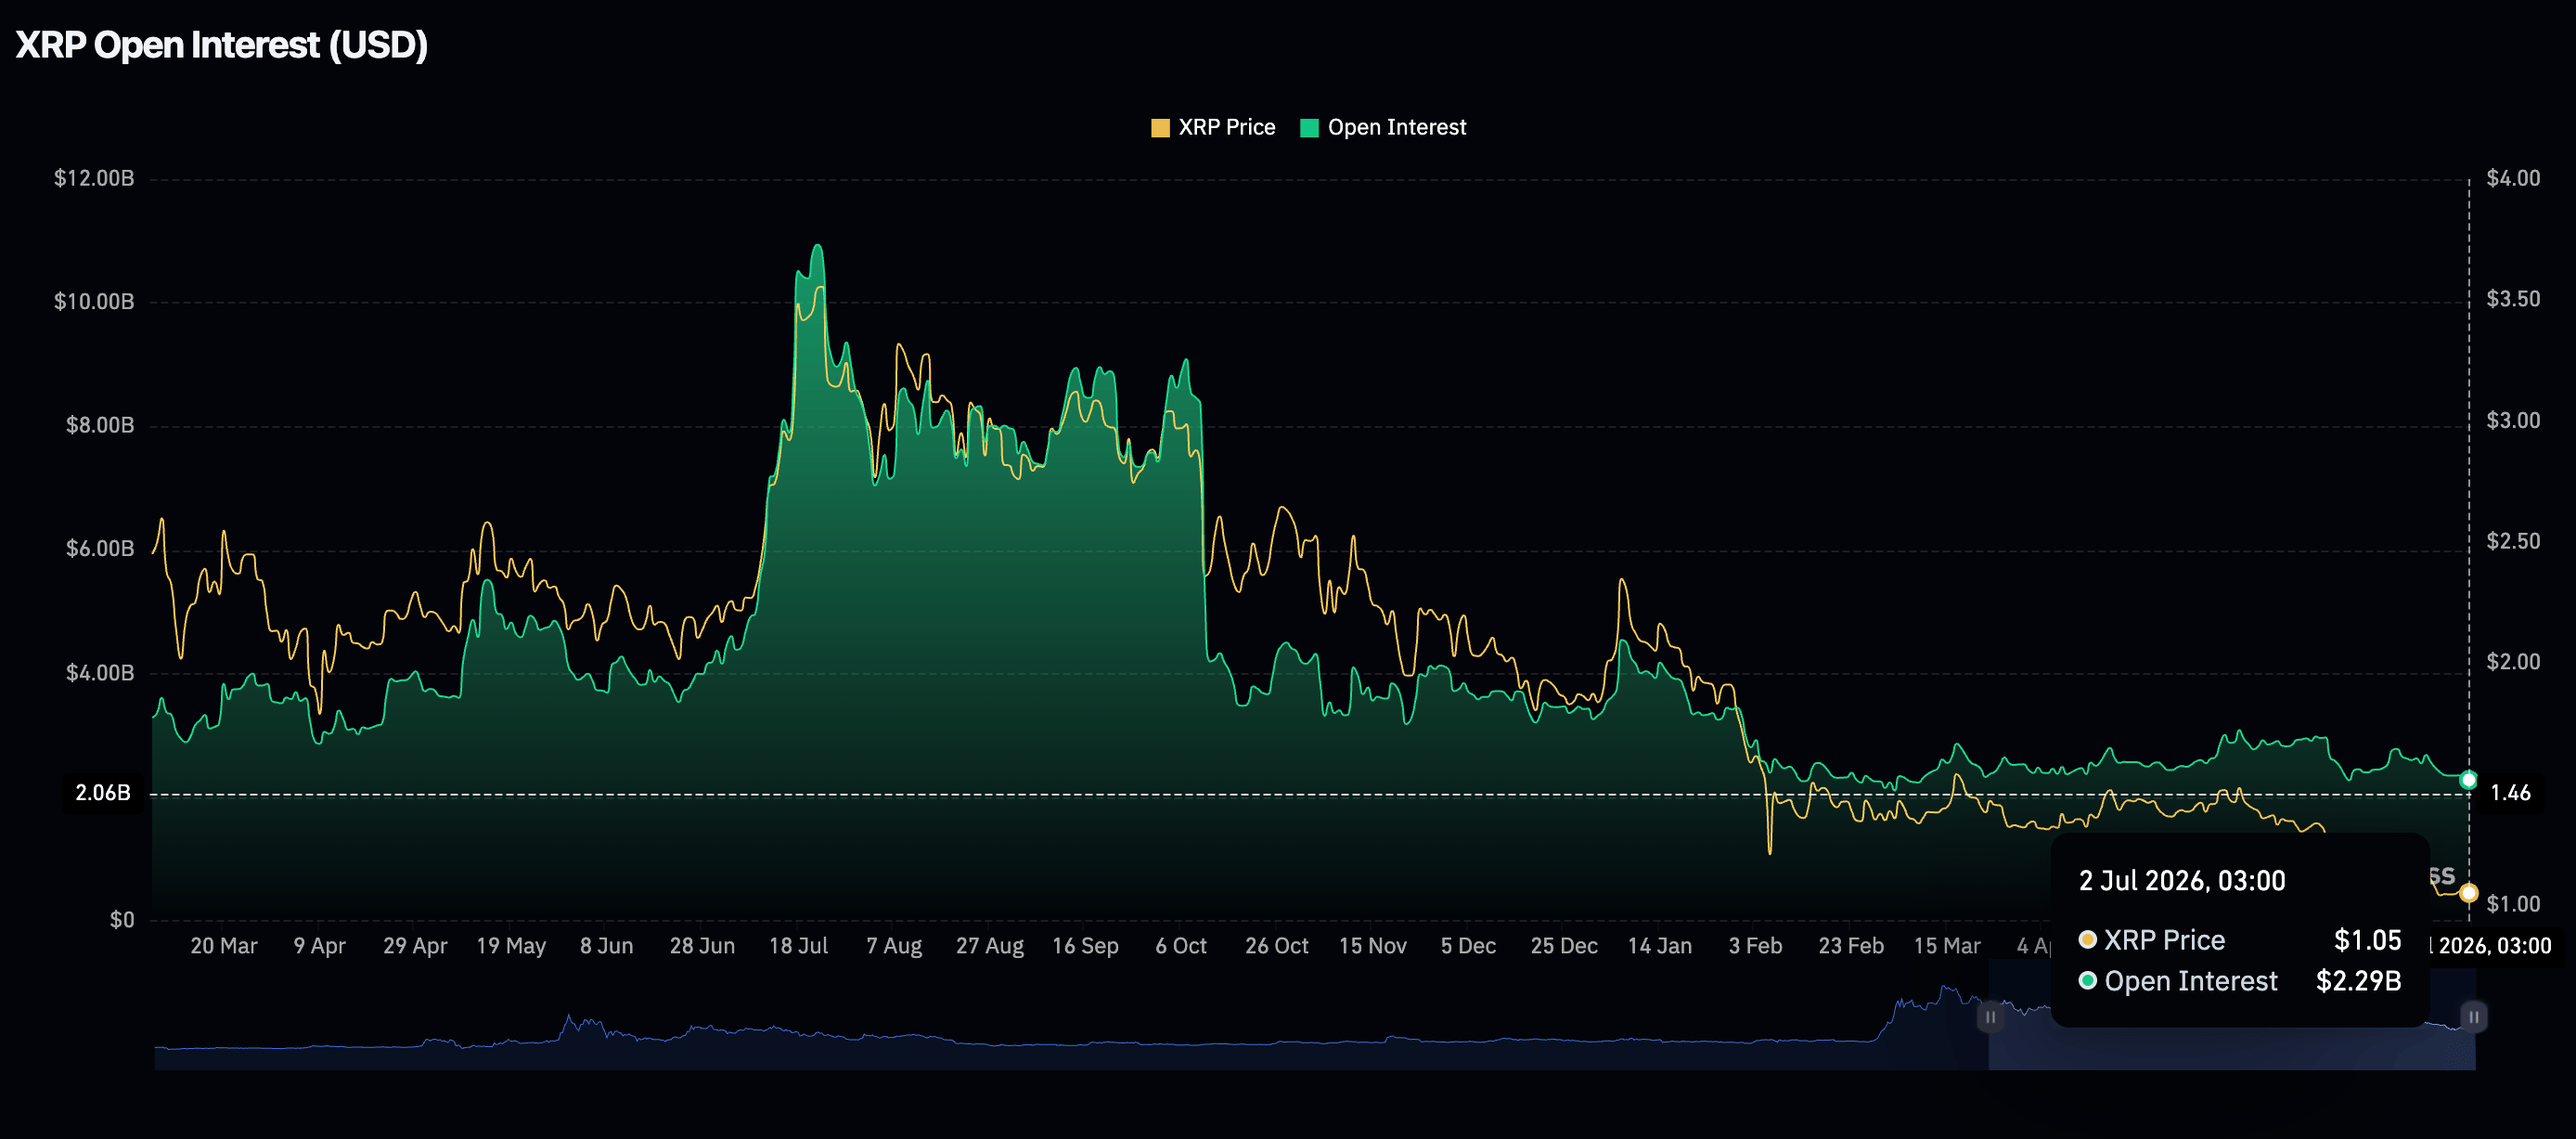
Retail demand continues to diminish, with futures Open Interest (OI) falling to $2.29 billion on Thursday, from $2.31 billion the day before. A broader scope cements a lack of investor confidence in XRP’s short to medium-term outlook. In other words, bears are willing to pay a premium to keep shorting XRP while bulls shun opening new long positions.
Price analysis: XRP builds momentum for short-term breakout
XRP trades at $1.07, extending its recovery from support testes at $1.03. Despite the upswing, the token appears to maintain a bearish near-term bias as the price remains below the key Exponential Moving Averages (EMAs). The 50-day EMA at $1.19, the 100-period EMA at $1.30 and the 200-day EMA at $1.52 all sit overhead as dynamic resistance, reinforcing the broader downside structure.
XRP also hovers beneath the Bollinger Bands' middle boundary at $1.11, while the potential trendline break area around $1.22 adds another cap on recovery attempts.
Momentum is mixed, with the Relative Strength Index (RSI) above 40 on the daily chart still below the neutral 50 line even as the Moving Average Convergence Divergence (MACD) histogram turns marginally positive, hinting at a modest improvement in short-term pressure.
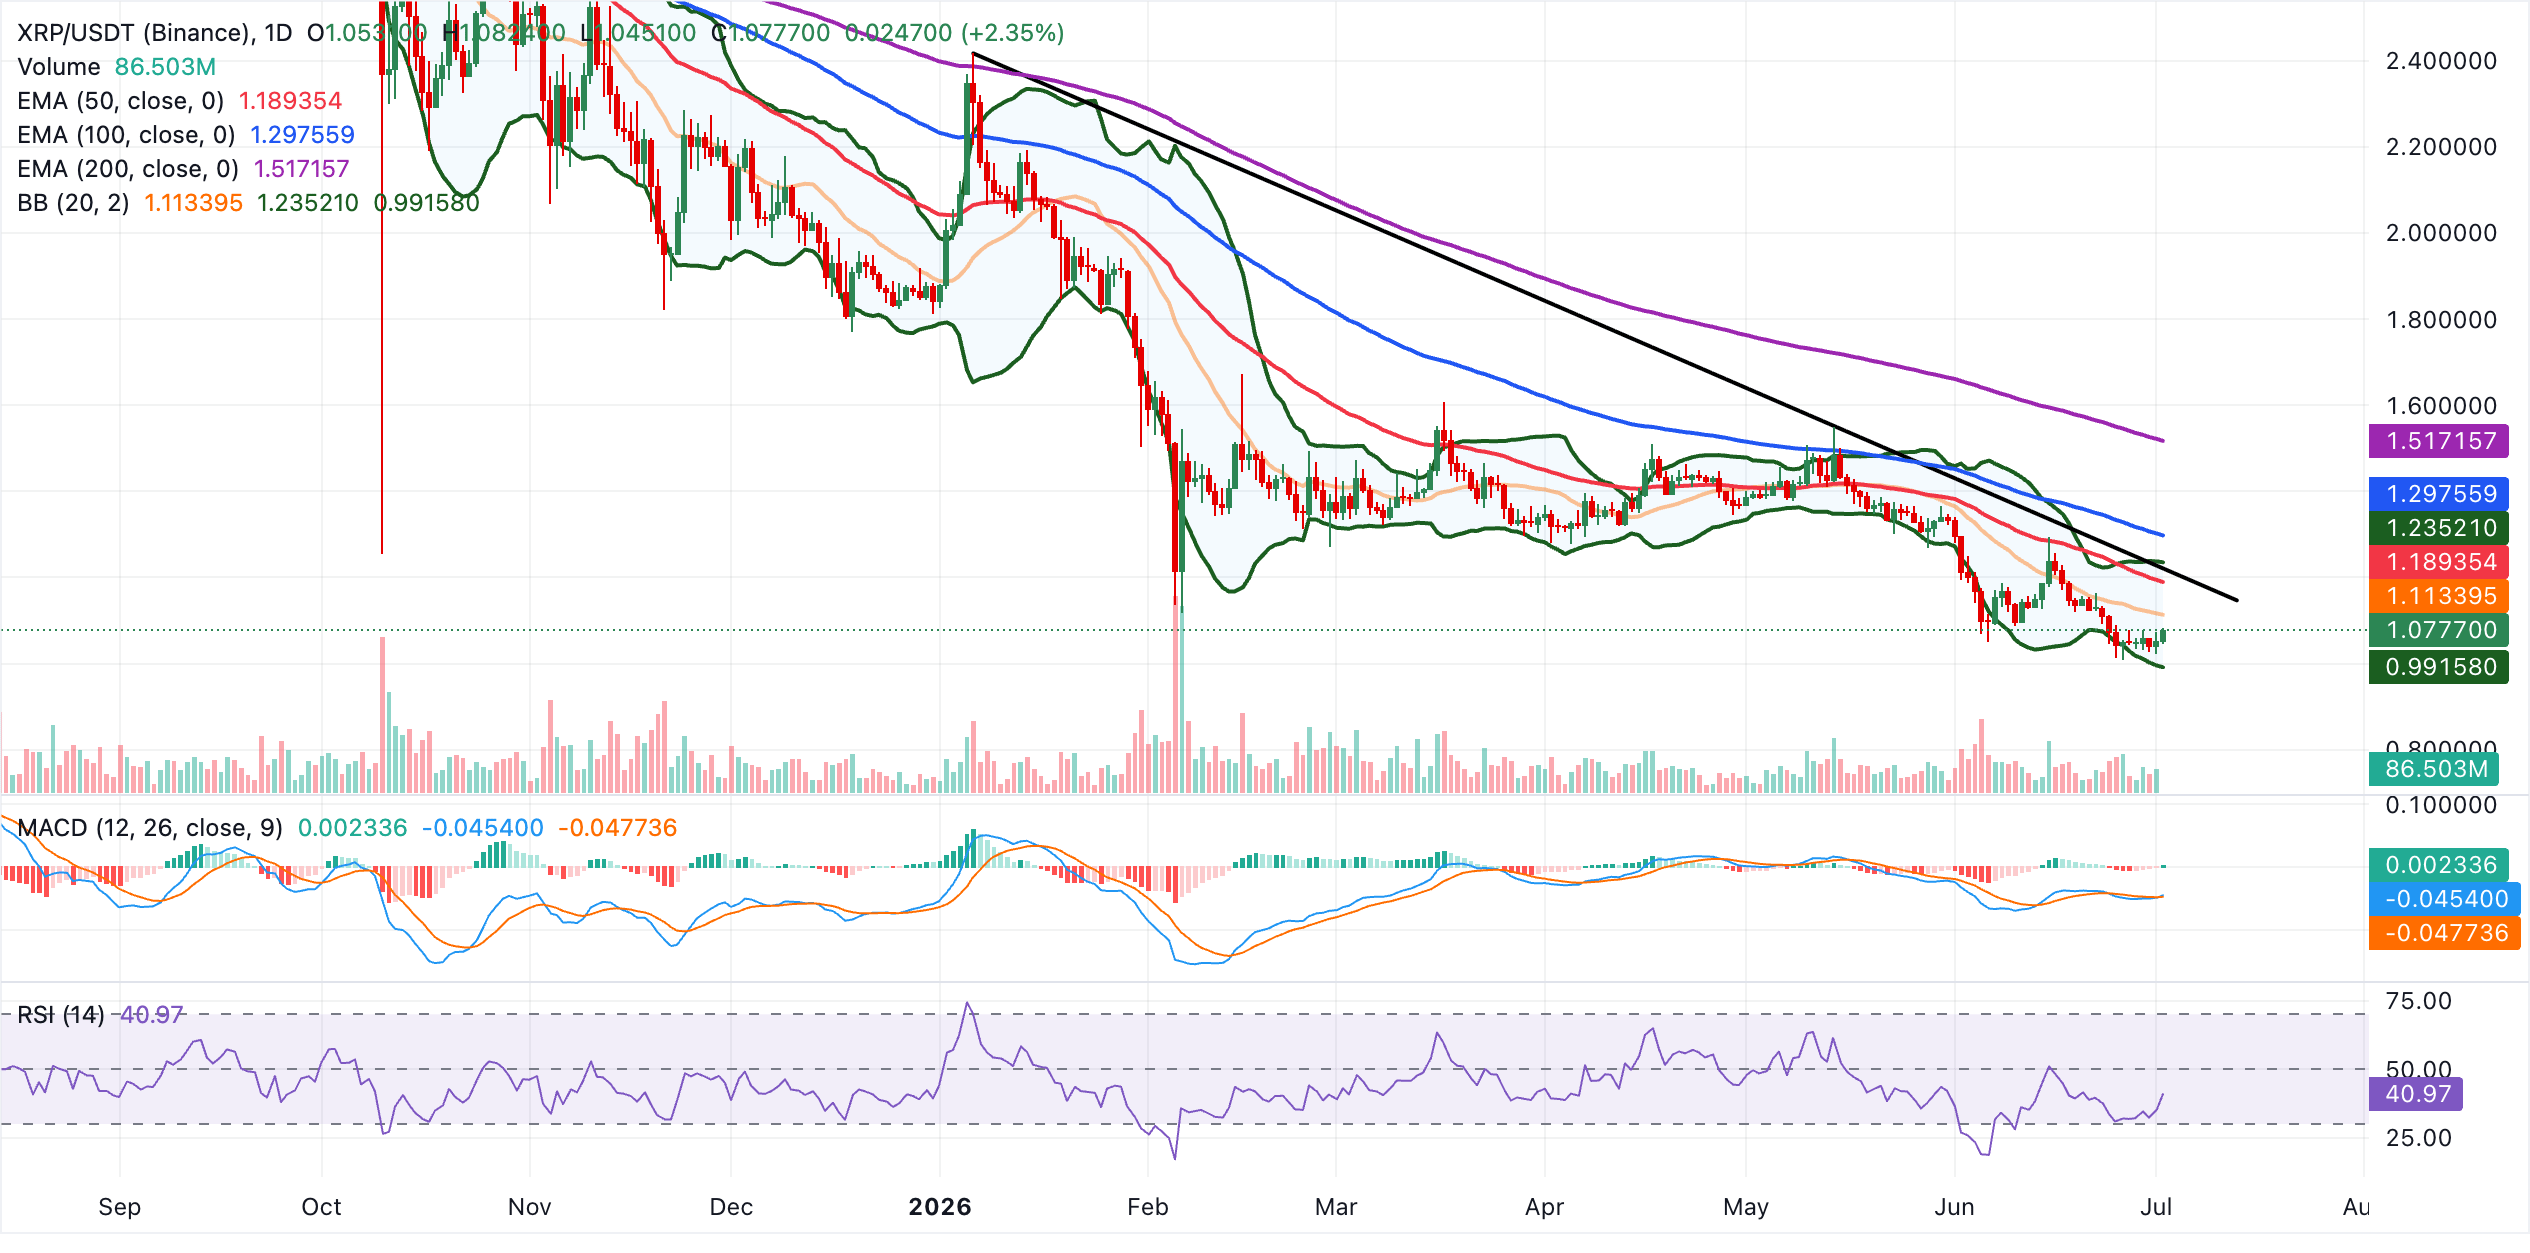
Initial resistance lies at the Bollinger middle band at $1.11, followed by the 50-day EMA near $1.19 and the downward trendline region around $1.22. A stronger bullish extension would need a daily close above the Bollinger upper band at $1.24 to target the 100-day EMA at $1.30, with the 200-day EMA at $1.52 acting as a more distant structural ceiling.
On the flip side, the Bollinger lower band at $0.99 stands as the next notable support likely to attract fresh interest from buyers.
(The technical analysis of this story was written with the help of an AI tool.)
Open Interest, funding rate FAQs
Higher Open Interest is associated with higher liquidity and new capital inflow to the market. This is considered the equivalent of increase in efficiency and the ongoing trend continues. When Open Interest decreases, it is considered a sign of liquidation in the market, investors are leaving and the overall demand for an asset is on a decline, fueling a bearish sentiment among investors.
Funding fees bridge the difference between spot prices and prices of futures contracts of an asset by increasing liquidation risks faced by traders. A consistently high and positive funding rate implies there is a bullish sentiment among market participants and there is an expectation of a price hike. A consistently negative funding rate for an asset implies a bearish sentiment, indicating that traders expect the cryptocurrency’s price to fall and a bearish trend reversal is likely to occur.
Author

John Isige
FXStreet
John Isige is a seasoned cryptocurrency journalist and markets analyst committed to delivering high-quality, actionable insights tailored to traders, investors, and crypto enthusiasts. He enjoys deep dives into emerging Web3 tren



