Top 3 Bitcoin, Ethereum & Ripple price prediction: Capitulation in an emotional market
- Heavy falls across the Crypto board in the European opening take Ethereum back to $500
- Buying levels keep increasing as better prices appear in the charts

Cryptocurrencies are losing about 12 million in market capitalization in today's session. There are violent slides, with Ethereum being the main ruler. Last week we pointed how lots of portfolios were edging back to Bitcoin and the market seems to be confirming this assessment.
Today is a day of anxiety and tension for the Crypto investor with the levels reached. This is natural. Psychological mechanisms tend to lead us onto seeing this kind of situations as threats to our savings, but markets behave otherwise.
In order to buy at good entry levels, individuals need to lose faith in their initial behavior, capitulate from their initial beliefs and get out of their positions at the best price available. These three goals are achieved through fear. And fear doesn't mix very well with rational thinking. We don't know if the current slide will end, but my experience tells me that few traders will take profit from fear.
BTC/USD 4H chart
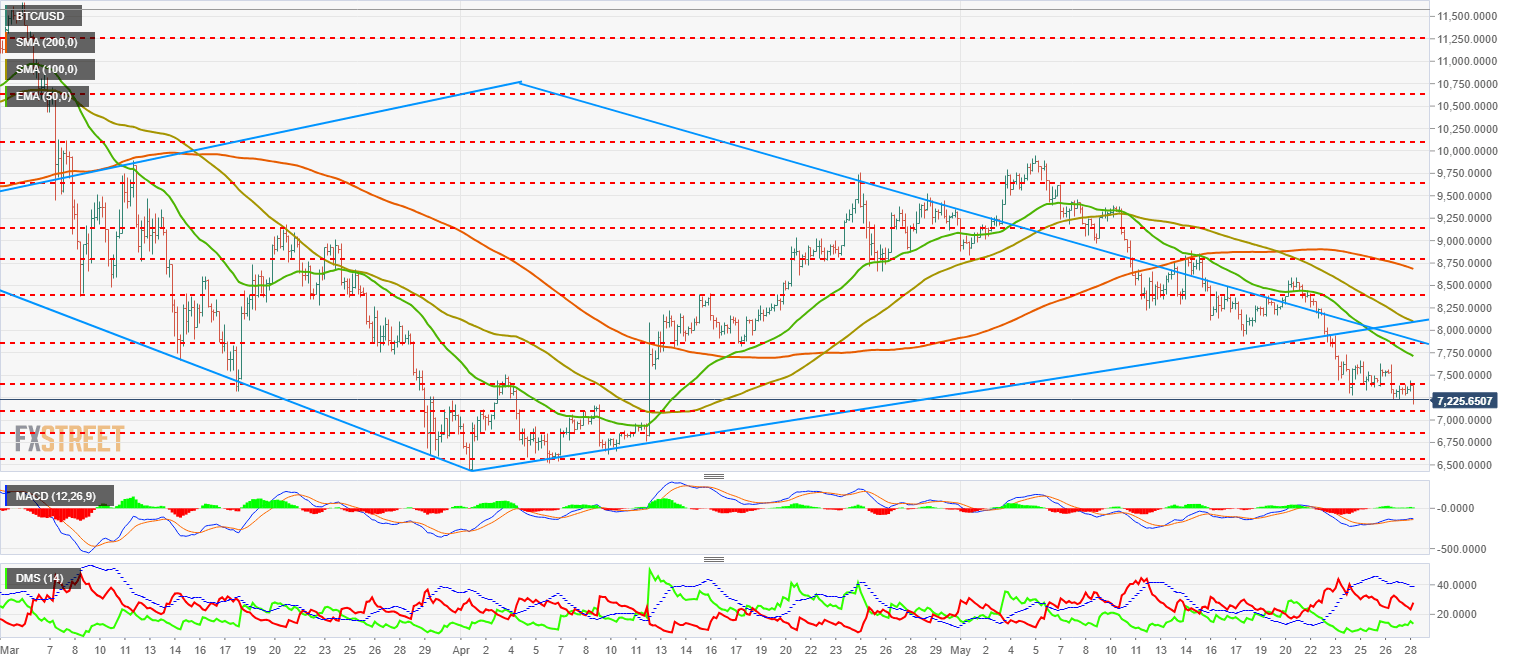
Bitcoin is falling around 1.22% today, trading back at the $7235 level and having left a $7171 low during the Asian trading session. The chart has deepened into the most negative area of the technical outlook, so visiting $7100 again feels inevitable in the upcoming hours. Once BTC/USD reaches that level, if the bears keep the foot on the pedal they might target $7000, $6870 and $6570. On the other hand, any attempt of changing directions will require a considerable effort, needing to clear the resistances at $7390, $700 and $7850. Let's see what the indicators are telling us today:
MACD in the Bitcoin 4-hour chart is showing a bullish lateral profile, clearly divergent with the price action. This divergent structure is also clear about how the price behaved during the first two weeks of May.
Directional Movement Index in the same chart is showing how the buyers have been increasing once the lows were being reached, while the sellers have been retracing, with some panic spikes during the bearish legs. We can say that the Blockchain technology is allowing the decentralized exchange between emotions and capital. An application of the brand new technology to the old techniques of speculation.
ETH/USD 4H chart
-636631018217016594.png)
Ethereum is suffering much more during the day and is now sliding about 7.5% during the first hours of the European session. This represents an improvement from the lows reached during the Asian session, where it left a low at $500 and a big tail in the candlestick that is indicating a big buying interest in these levels. ETH/USD has recovered the $530 support but it doesn't seem that this is a position strong enough to stop the current bearish run.
Below the current price, beyond the aforementioned $500 level, supports are at $485, $460 and $440. On the bullish side, resistances are at $565, $590 and $612.
MACD in the Ethereum 4-hour chart is now crossed to the downside, differing from the Bitcoin one. We don't see any divergent structure here, and it doesn't look like that is brewing neither.
Directional Movement Index in the same chart shows how buyers profited from the falling prices from last week but have now lost faith and are retreating. Sellers, on the other hand, have risen and are now showing a typical panic behavior in the market.
XRP/USD 4H chart
-636631018614993413.png)
XRP/USD is trading inside another technical scenario, already inside an expansive structure although exploring the bearish territory of the scenario. Ripple is sliding above a trendline that takes it to new relative lows around $0.5689. Below there, supports at $0.5623, followed by $0.55 and finally the vital support at $0.50.
On the upside, the scenario is pretty congested, with resistances at $0.583 and $0.60. There is another very strong resistance between $0.63 and $0.65.
MACD in the Ripple 4-hour chart is crossed to the downside, leaving a divergent profile in the mid-term, with respect to the early May action. The next three periods are very important to attract more attention.
Directional Movement Index in the same chart is showing how buyers have only lost faith in the last leg. Sellers, on the other hand, are spiking, showing the uneasiness surrounding the Crypto markets.
Author

Tomas Salles
FXStreet
Tomàs Sallés was born in Barcelona in 1972, he is a certified technical analyst after having completing specialized courses in Spain and Switzerland. He expanded his technical training following the guidance of great experts on the financial markets.


