Crypto Market Overview: Bitcoin loses softer CPI gains – Virtuals Protocol, OKB rise
- Bitcoin hovers around $63,000 on Thursday, capped below the 50-day EMA at $64,523.
- US CPI data for July came in at 3.4% the previous day, suggesting easing inflation and lowering the odds of a rate hike.
- Virtuals Protocol and OKB have emerged as top performers over the last 24 hours.

Bitcoin (BTC) is trading around $63,000 at press time, after three consecutive days of losses. The US Consumer Price Index (CPI) for July met market expectations of 3.4% the previous day, resulting in a mild rebound in BTC above $64,000, but it was lost later in the day, leading to a bearish close. Virtuals Protocol (VIRTUAL) and OKB (OKB) have emerged as top performers over the last 24 hours.
Technical outlook: Bitcoin risks a revisit to $60,000
Bitcoin is trading in the red on Thursday, keeping a bearish near-term bias as it holds beneath a dense cap of the 50-day, 100-day, and 200-day Exponential Moving Averages (EMA) at $64,523, $66,718, and $73,303, respectively.
Momentum indicators back this weaker tone, with the Relative Strength Index (RSI) hovering around 45 and the Moving Average Convergence Divergence (MACD) crossing below its signal line, suggesting that downside pressure remains dominant.
From a technical perspective, BTC is on the verge of closing below the upward trendline near $63,814, which could confirm the bearish breakout. Looking down, the key support for Bitcoin could emerge at the July 6 low at $61,307.
On the topside, initial resistance is seen at the 50-day EMA at $64,523 and a descending trendline coming in near $65,238.
Technical outlook: VIRTUAL and OKB eye further gains
Virtual Protocol is trading near the $0.6000 level at press time on Thursday, sustaining its 10% gains from the previous day. VIRTUAL maintains a near-term bullish bias as it holds above the 50-day EMA at $0.5859, but remains capped below an overhead trendline connecting the May 7 and July 11 highs around $0.6107.
The 100-day EMA at $0.6168 reinforces the resistance trendline, forming a major overhead cluster. A decisive close above this zone could target the June 15 high at $0.6728, which previously capped gains on July 21. Beyond that, the 200-day EMA at $0.6978 could serve as the next bullish target.
Momentum supports the short-term recovery, with the MACD line crossing above the signal line in the negative territory, resulting in a fresh bullish histogram. At the same time, the RSI at 55 crosses above the midline, signaling renewed buying pressure.
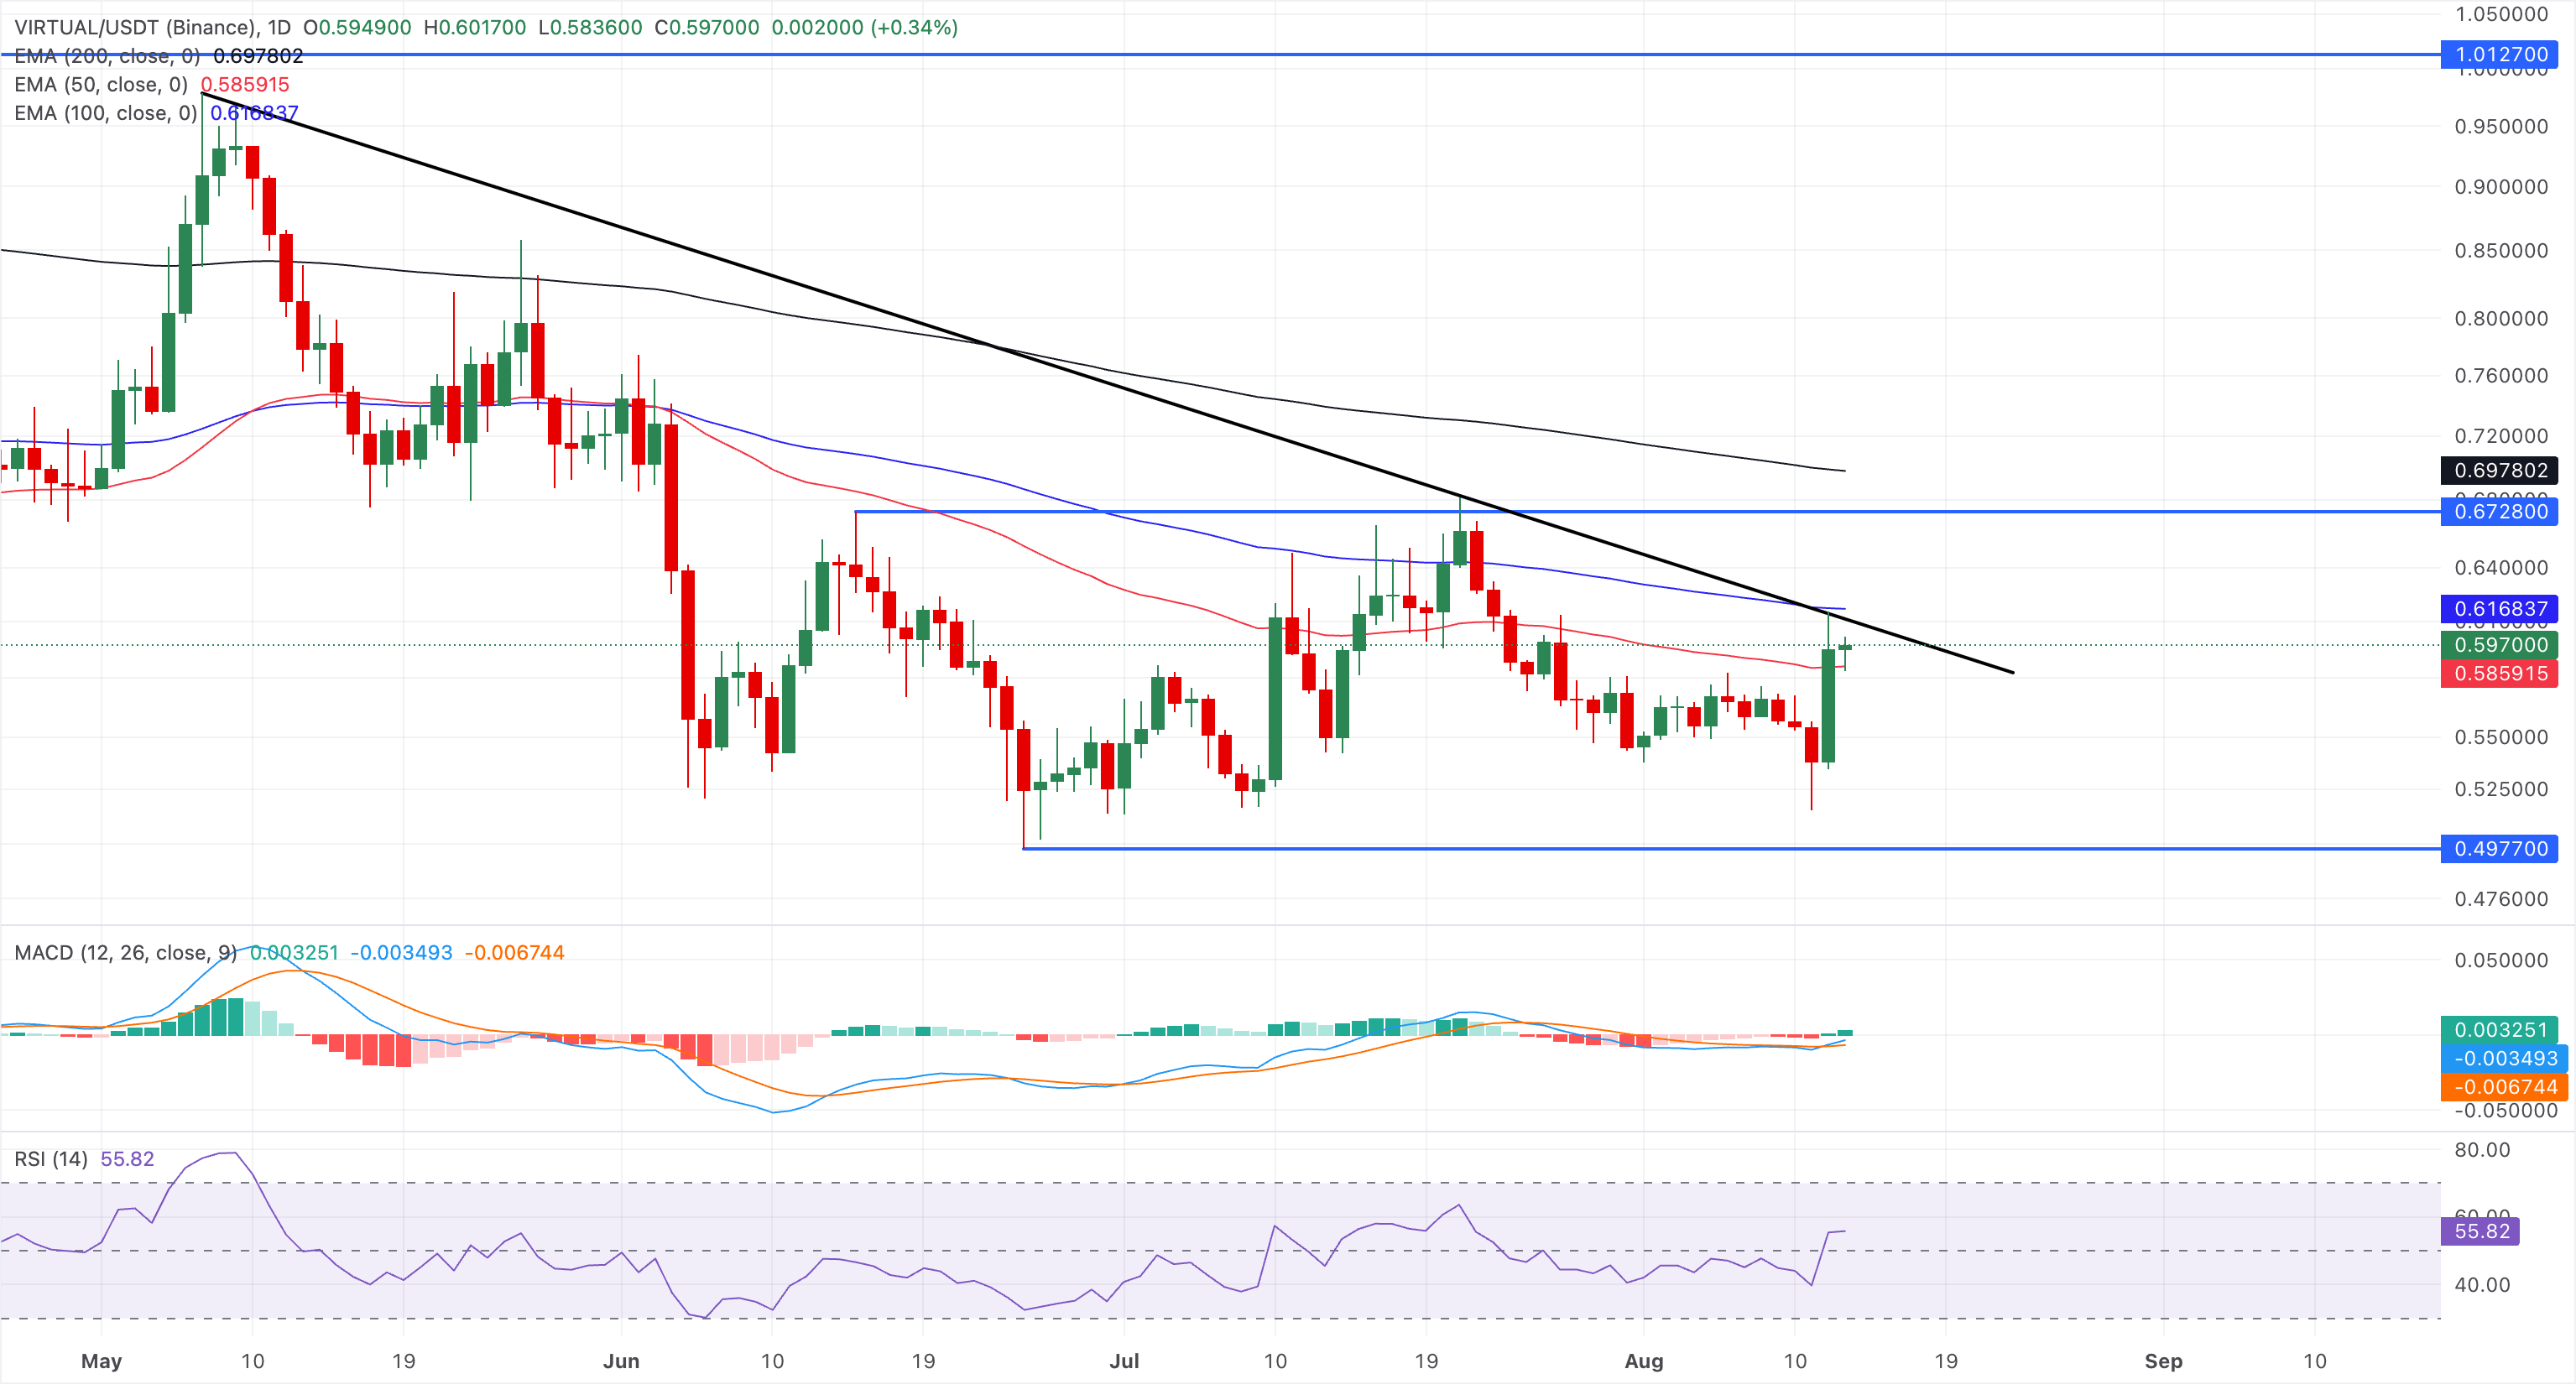
Looking downside, a slip below the 50-day EMA at $0.5859 could nullify the bullish breakout chances, likely extending a pullback toward the June 25 low at $0.4977.
OKB is up over 2% on Thursday, trading above the $100 psychological threshold. The token maintains a near-term bullish bias, with a steady upward trend over the last week and holding above all crucial EMAs.
A decisive close above the $100 mark could extend the rally toward the 127.2% Fibonacci extension level at $111, measured over the recent downswing from $99.64 to $65.76.
Momentum on the daily chart supports the positive recovery but warns of an overstretched buying phase. The MACD and signal line maintain an upward trend in the positive territory with an expanding bullish profile. However, the RSI at 85 rises higher into the overbought region, projecting increased odds of a corrective pullback.
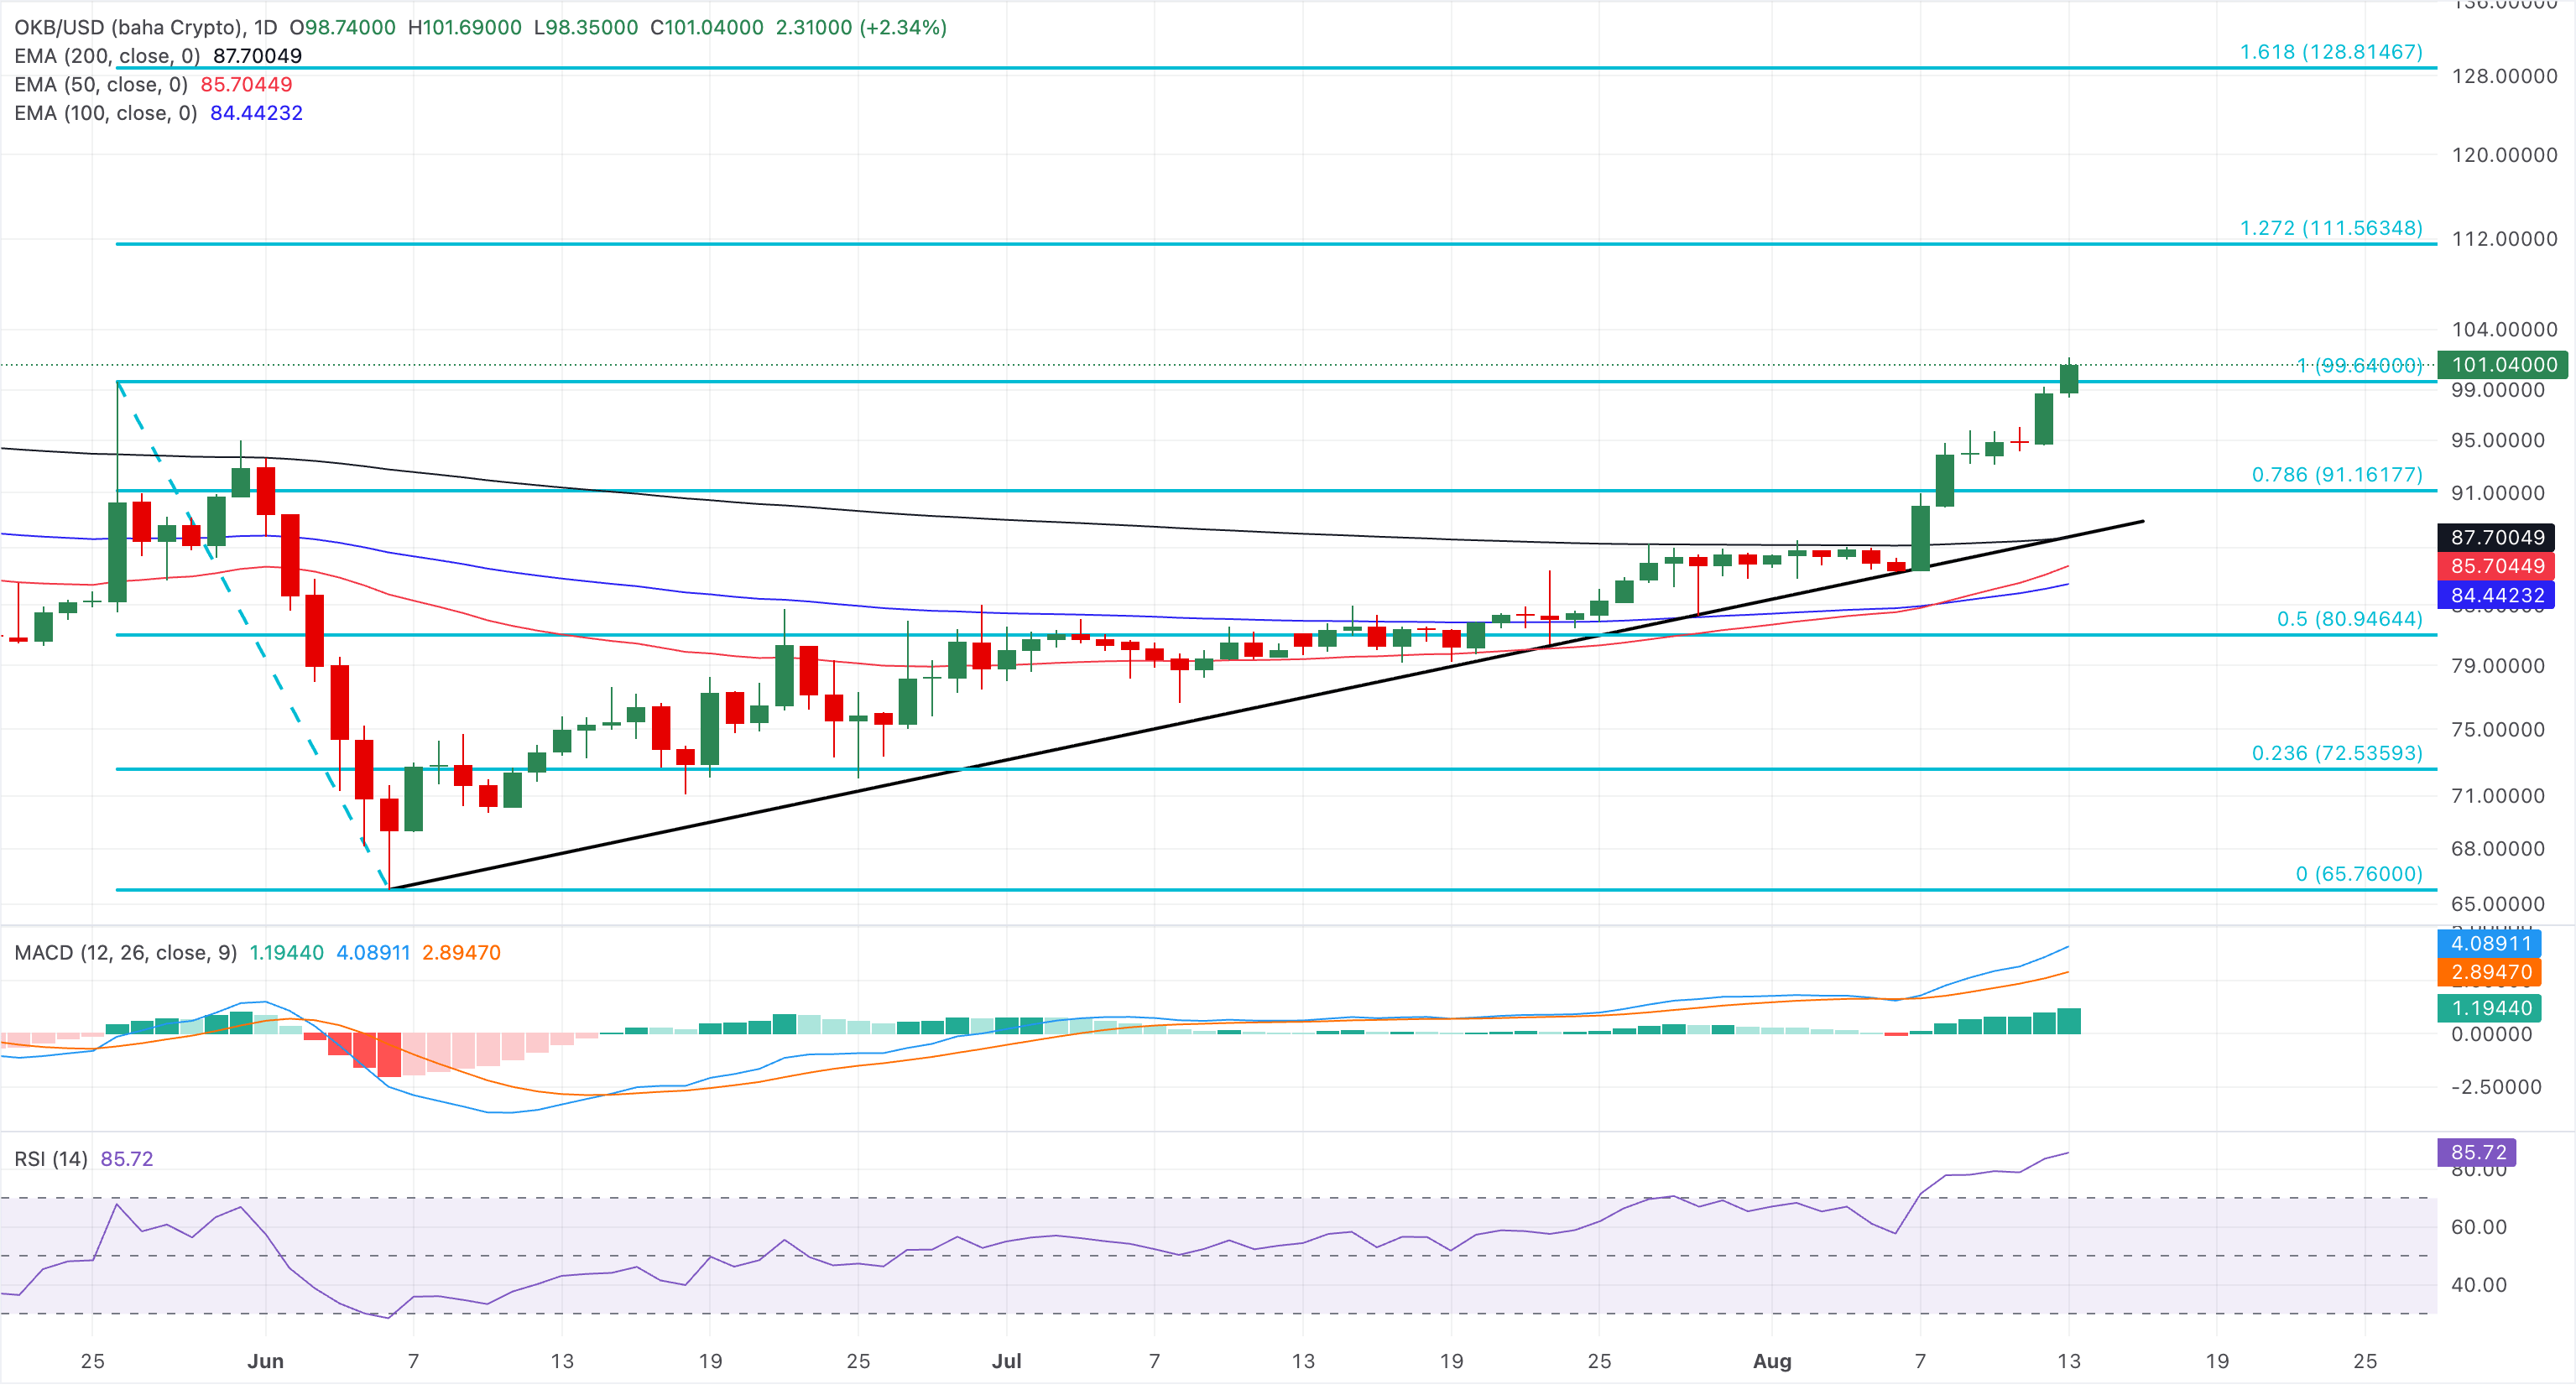
Looking down, the crucial support for OKB emerges at the 78.6% Fibonacci retracement level at $91.16.
(The technical analysis of this story was written with the help of an AI tool. Know more.)
Author

Vishal Dixit
FXStreet
Vishal Dixit holds a B.Sc. in Chemistry from Wilson College but found his true calling in the world of crypto.