Story, Aster, Flare, and Avalanche lead crypto market losses as liquidations top $1 billion
- Story records a near 30% drop in the last 24 hours, outpacing the broader cryptocurrency market.
- Aster, Flare, and Avalanche face a similar sell-off, resulting in double-digit losses.
- Crypto market liquidation tops $1 billion, signaling a risk-off sentiment.

Story (IP), Aster (ASTER), Flare (FLR), and Avalanche (AVAX) are leading losses over the last 24 hours as the broader cryptocurrency market faces a sell-off. The panic is mainly due to the possibility of a US Government shutdown on Wednesday if the members of Congress are unable to achieve a funding agreement by next Tuesday.
Amidst panic, CoinGlass reports over $1 billion in long liquidation in the cryptocurrency market, indicating a risk-off sentiment.
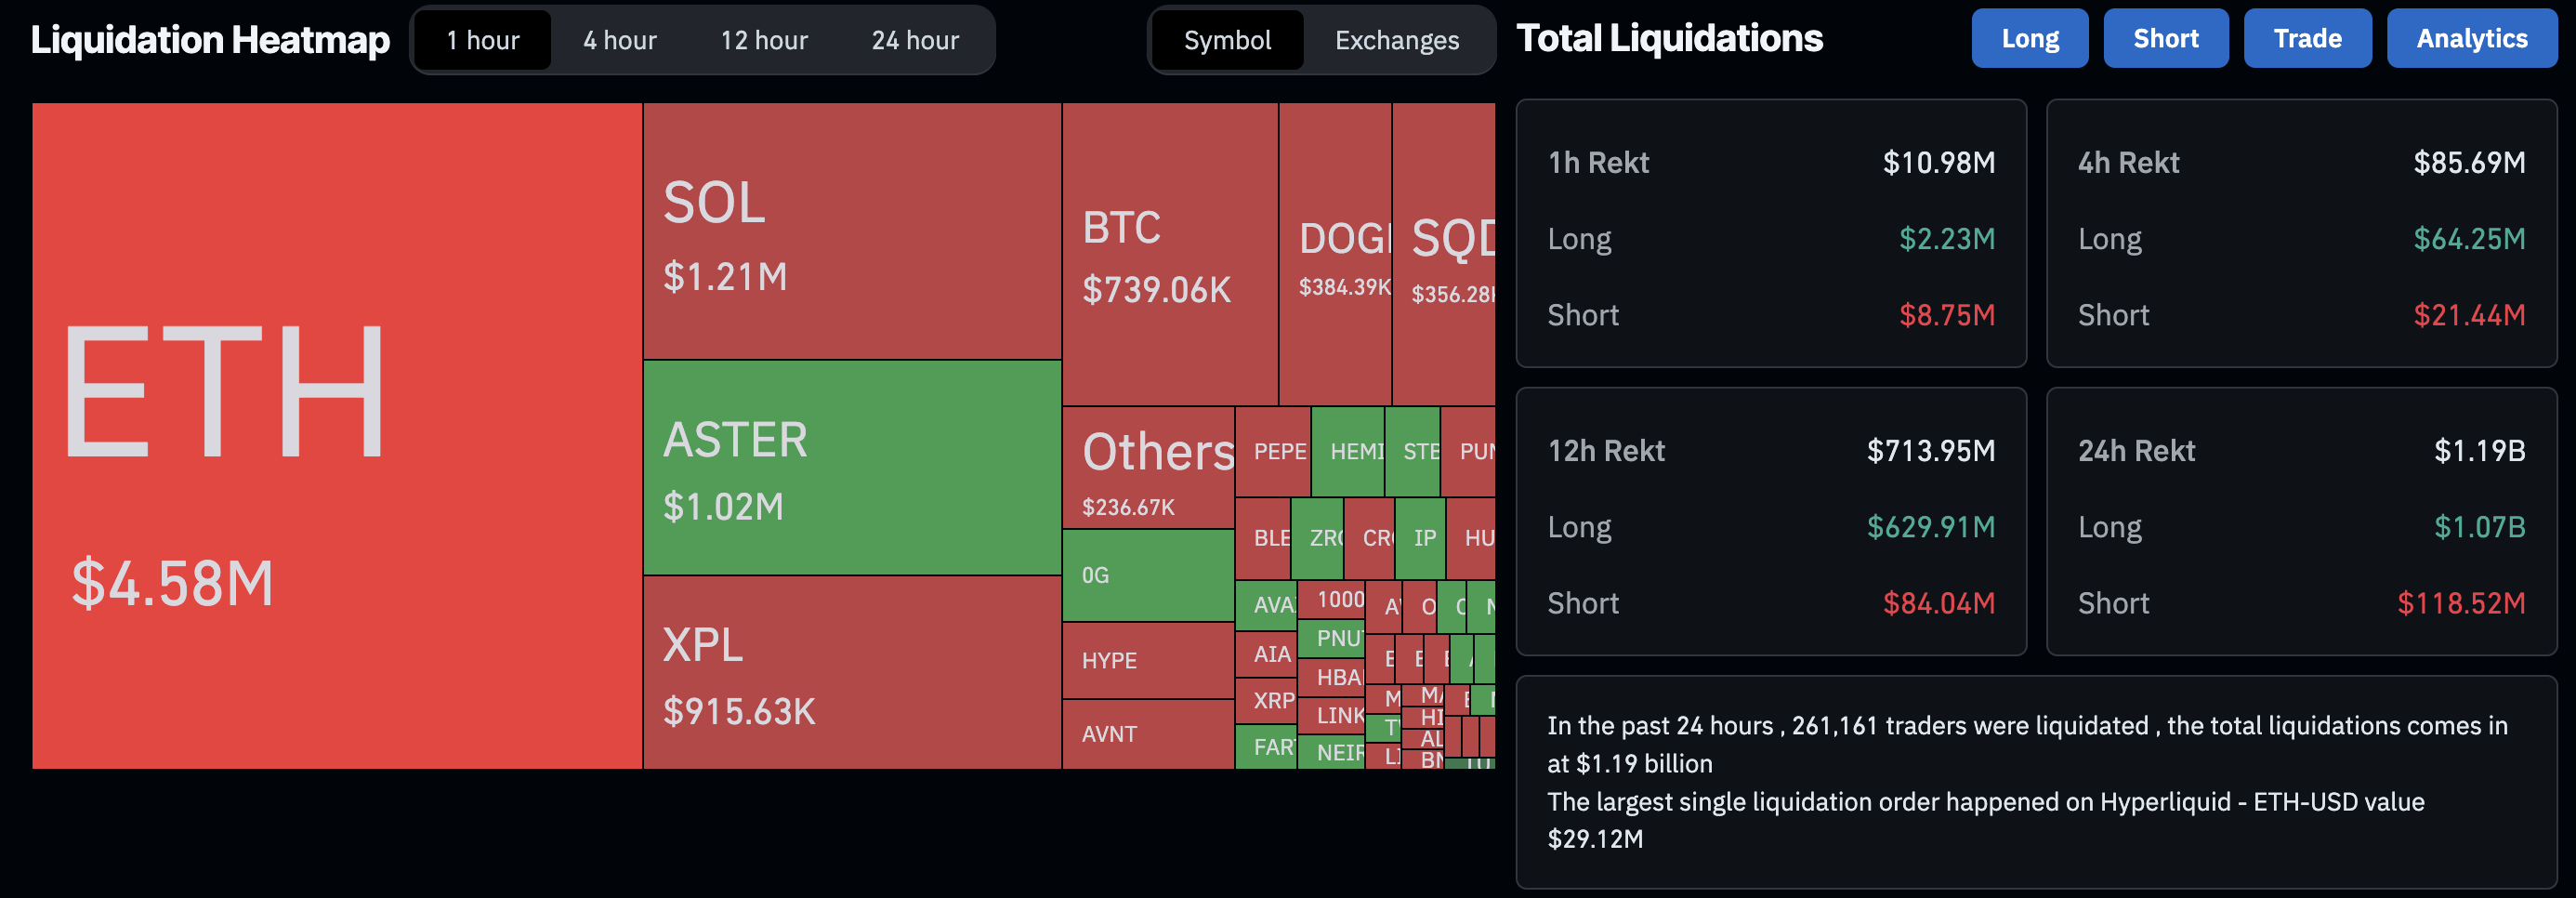
Crypto market liquidations. Source: CoinGlass
Additionally, US President Donald Trump is imposing tariffs on pharmaceuticals, kitchen cabinets, heavy trucks, and other products, which will take effect on October 1, and is adding to the risk of new trade disruptions.

Story risks falling below a rising channel
Story edges lower by 4% at press time on Friday, extending the 26% drop from the previous day. The declining trend for the fourth consecutive day tests the lower boundary of a rising channel pattern on the daily chart.
If IP marks a decisive close below this trendline at $7.850, it would confirm the channel fallout. In such a case, the key areas of support are the 100-day and 200-day Exponential Moving Averages (EMAs) at $7.082 and $5.791, respectively.
The technical indicators on the daily chart indicate a sharp surge in selling pressure, as the Relative Strength Index (RSI) has dropped to 41, with room for further decline before reaching the oversold zone. Additionally, the Moving Average Convergence Divergence (MACD) and its signal line have maintained a downward trend since the crossover on Wednesday.
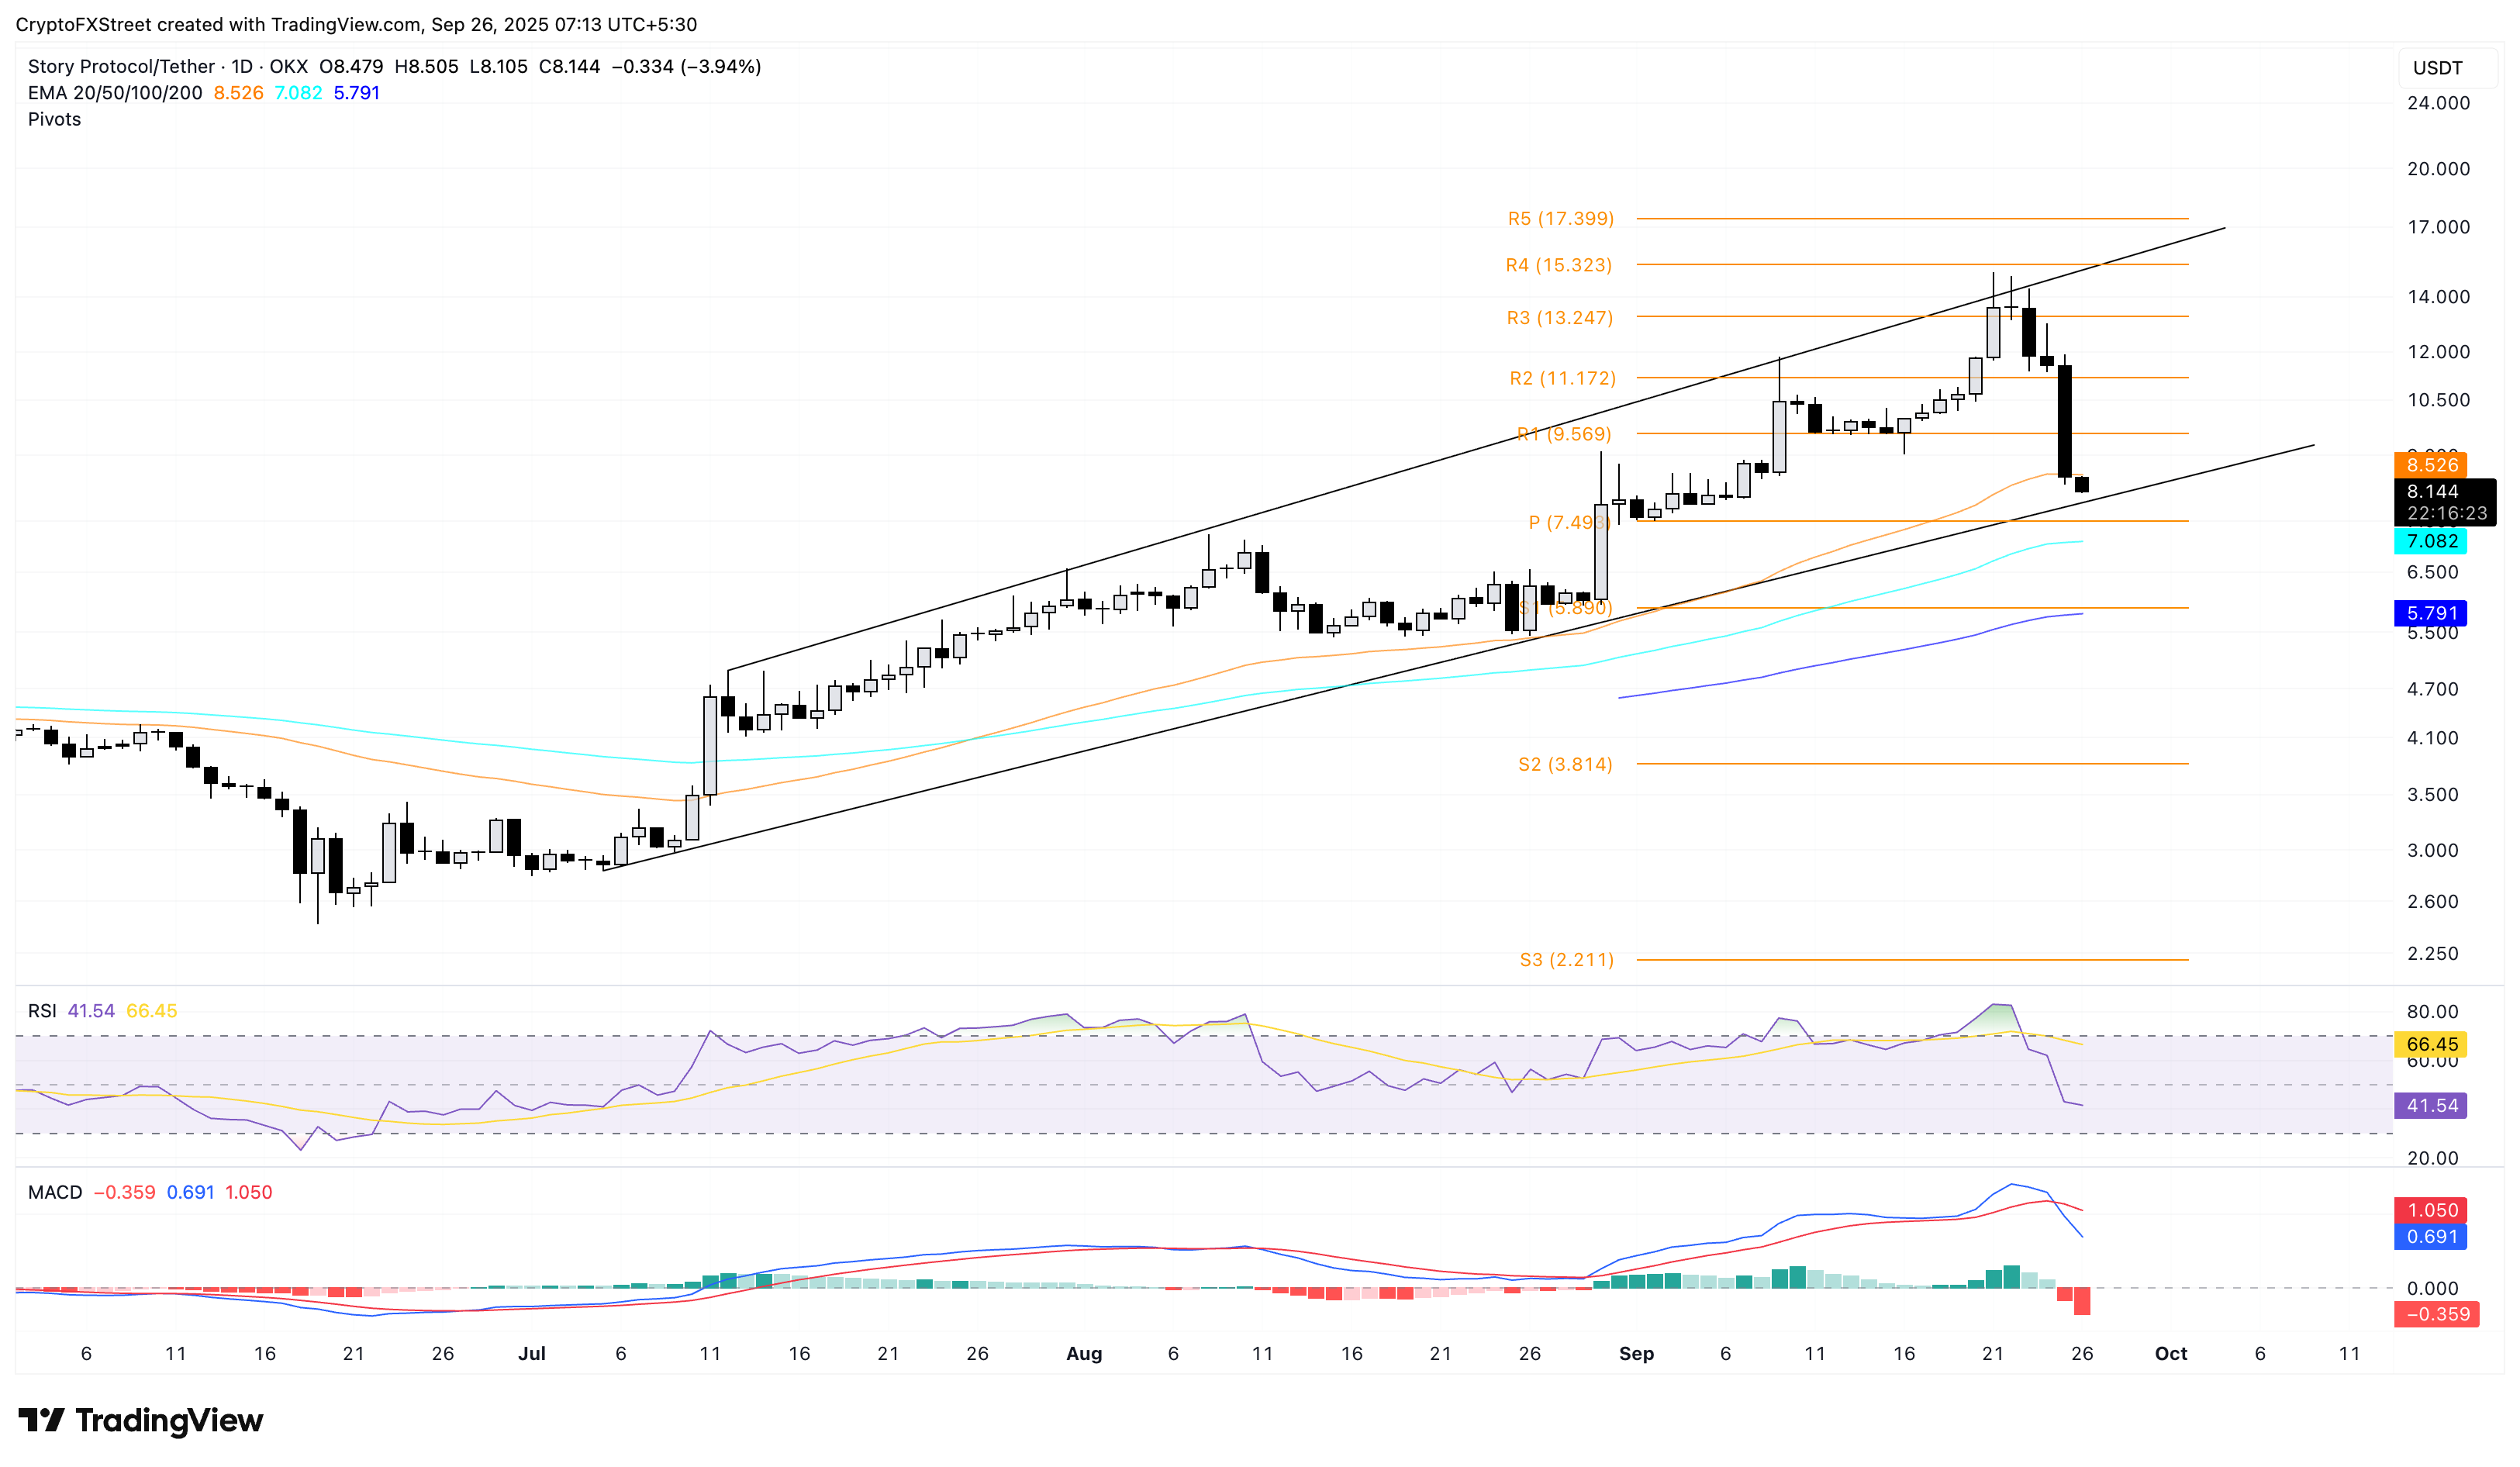
IP/USDT daily price chart.
If IP bounces back from the support trendline, it could challenge the R1 resistance level at $9.569.
Aster’s bearish turnaround eyes $1.30
Aster trades below $1.80 at the time of writing on Friday, extending the nearly 19% drop on Thursday by over 4% on the day. The sudden reversal below the $2.00 psychological milestone adds to the risk of ASTER testing the centre pivot level at $1.30 on the 4-hour chart.
The MACD and its signal line on the same chart display a declining trend with rising red histogram bars below the zero line, indicating a rise in bearish momentum. Additionally, the RSI has dropped below the halfway line to 49 from the overbought zone, suggesting a selling-side dominance.
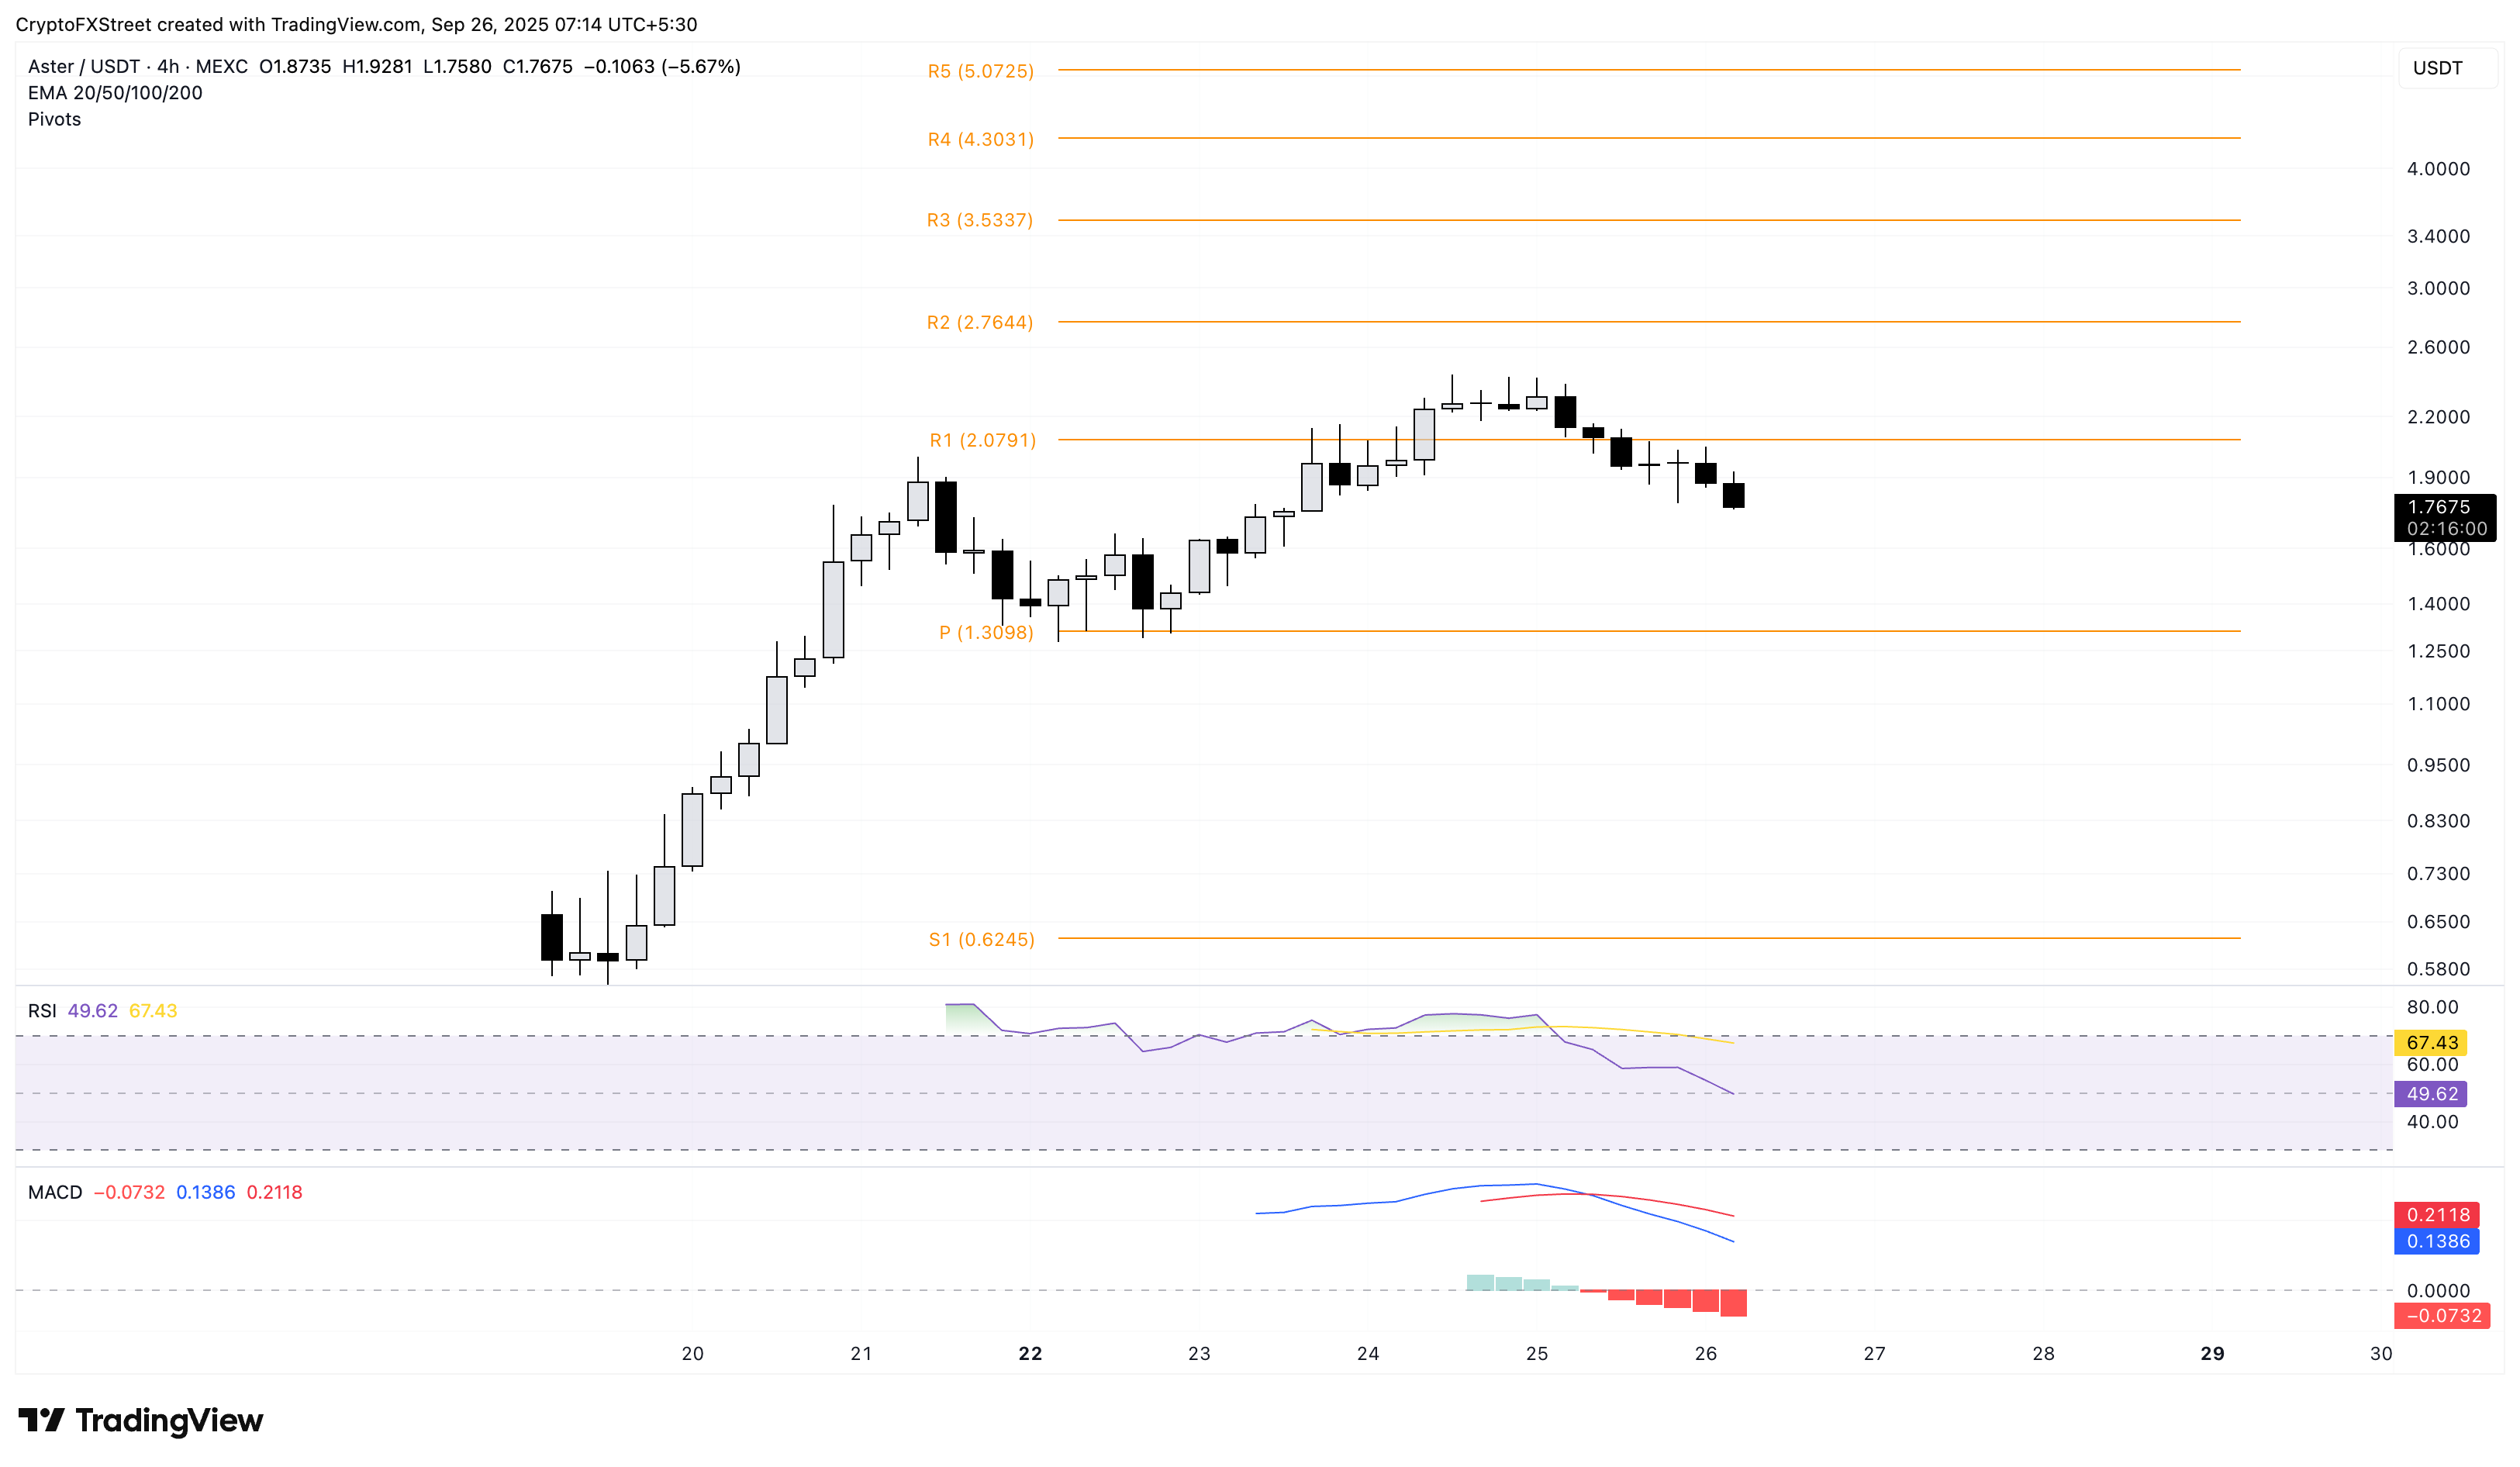
ASTER/USDT 4-hour price chart.
To reinstate an uptrend, ASTER should reclaim the R1 pivot level at $2.07, which would open the possibility of reaching the R2 resistance level at $2.76.
Flare loses FXRP launch gains, risks further decline
Flare is down over 3% at press time, extending the 9% loss from Wednesday. The sudden reversal erases the gains made on the launch of FAssets like FXRP, aiming to boost Ripple’s XRP liquidity and utility.
The immediate area of support for Flare lies at the 50-day EMA at $0.22685, followed by the 100-day EMA at $0.021638.
Even the technical indicators on the daily chart suggest a bearish incline as the MACD inches closer to its signal line, hinting at a potential crossover. Additionally, the RSI has dropped from the overbought region to 51, indicating a sharp decline in buying pressure with room for further correction.
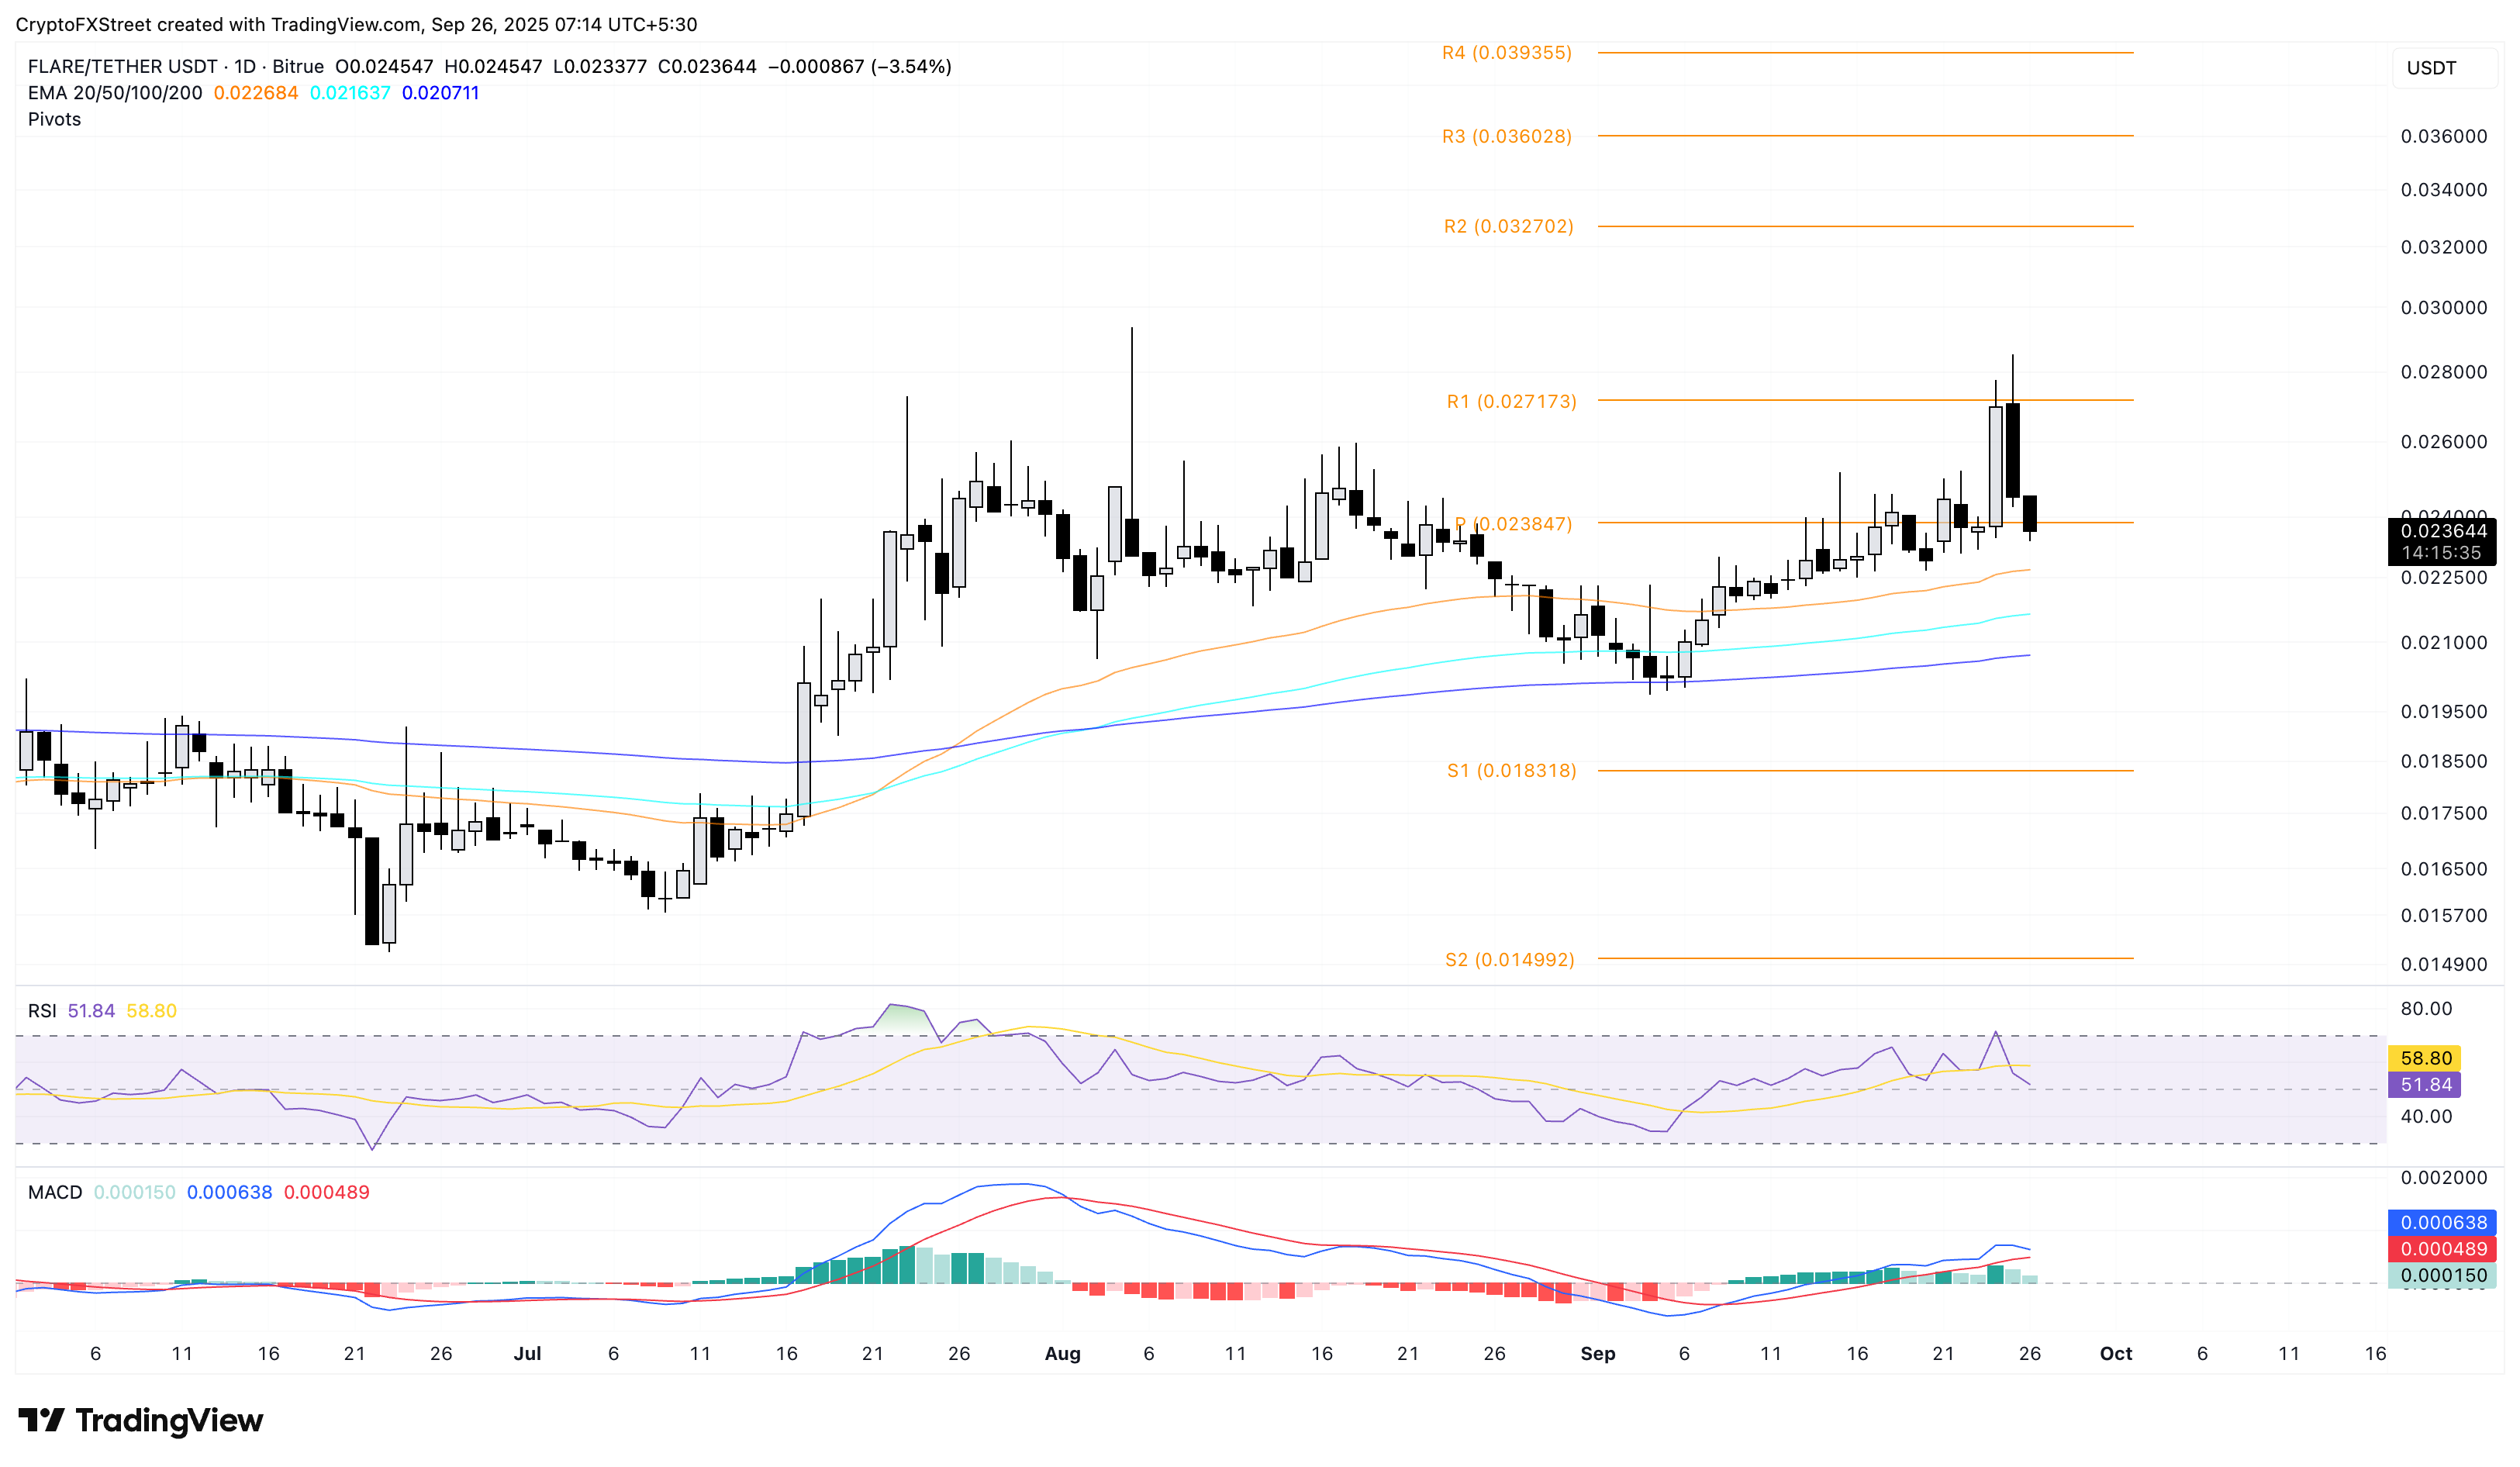
FLR/USDT daily price chart.
On the flip side, if FLR reclaims the centre pivot level at $0.023847, it could retest the R1 resistance at $0.027173.
Avalanche under bearish pressure, bears seek extension
Avalanche is trading below $30 at the time of writing on Friday, following the 11% drop from the previous day. AVAX is approaching its 50-day EMA at $27.48, which could serve as immediate dynamic support, potentially providing a short-term recovery.
On the upside, key areas of resistance for Avalanche are the 1.272 Fibonacci extension level at $31.10, which is extended from the $26.84 peak on May 12 to the $15.61 peak on June 22.
Still, the momentum indicators on the daily chart suggest underlying weakness as the RSI falls below the halfway line to 46 while the MACD crossed below its signal line on Thursday, igniting a fresh wave of red histograms below the zero line.
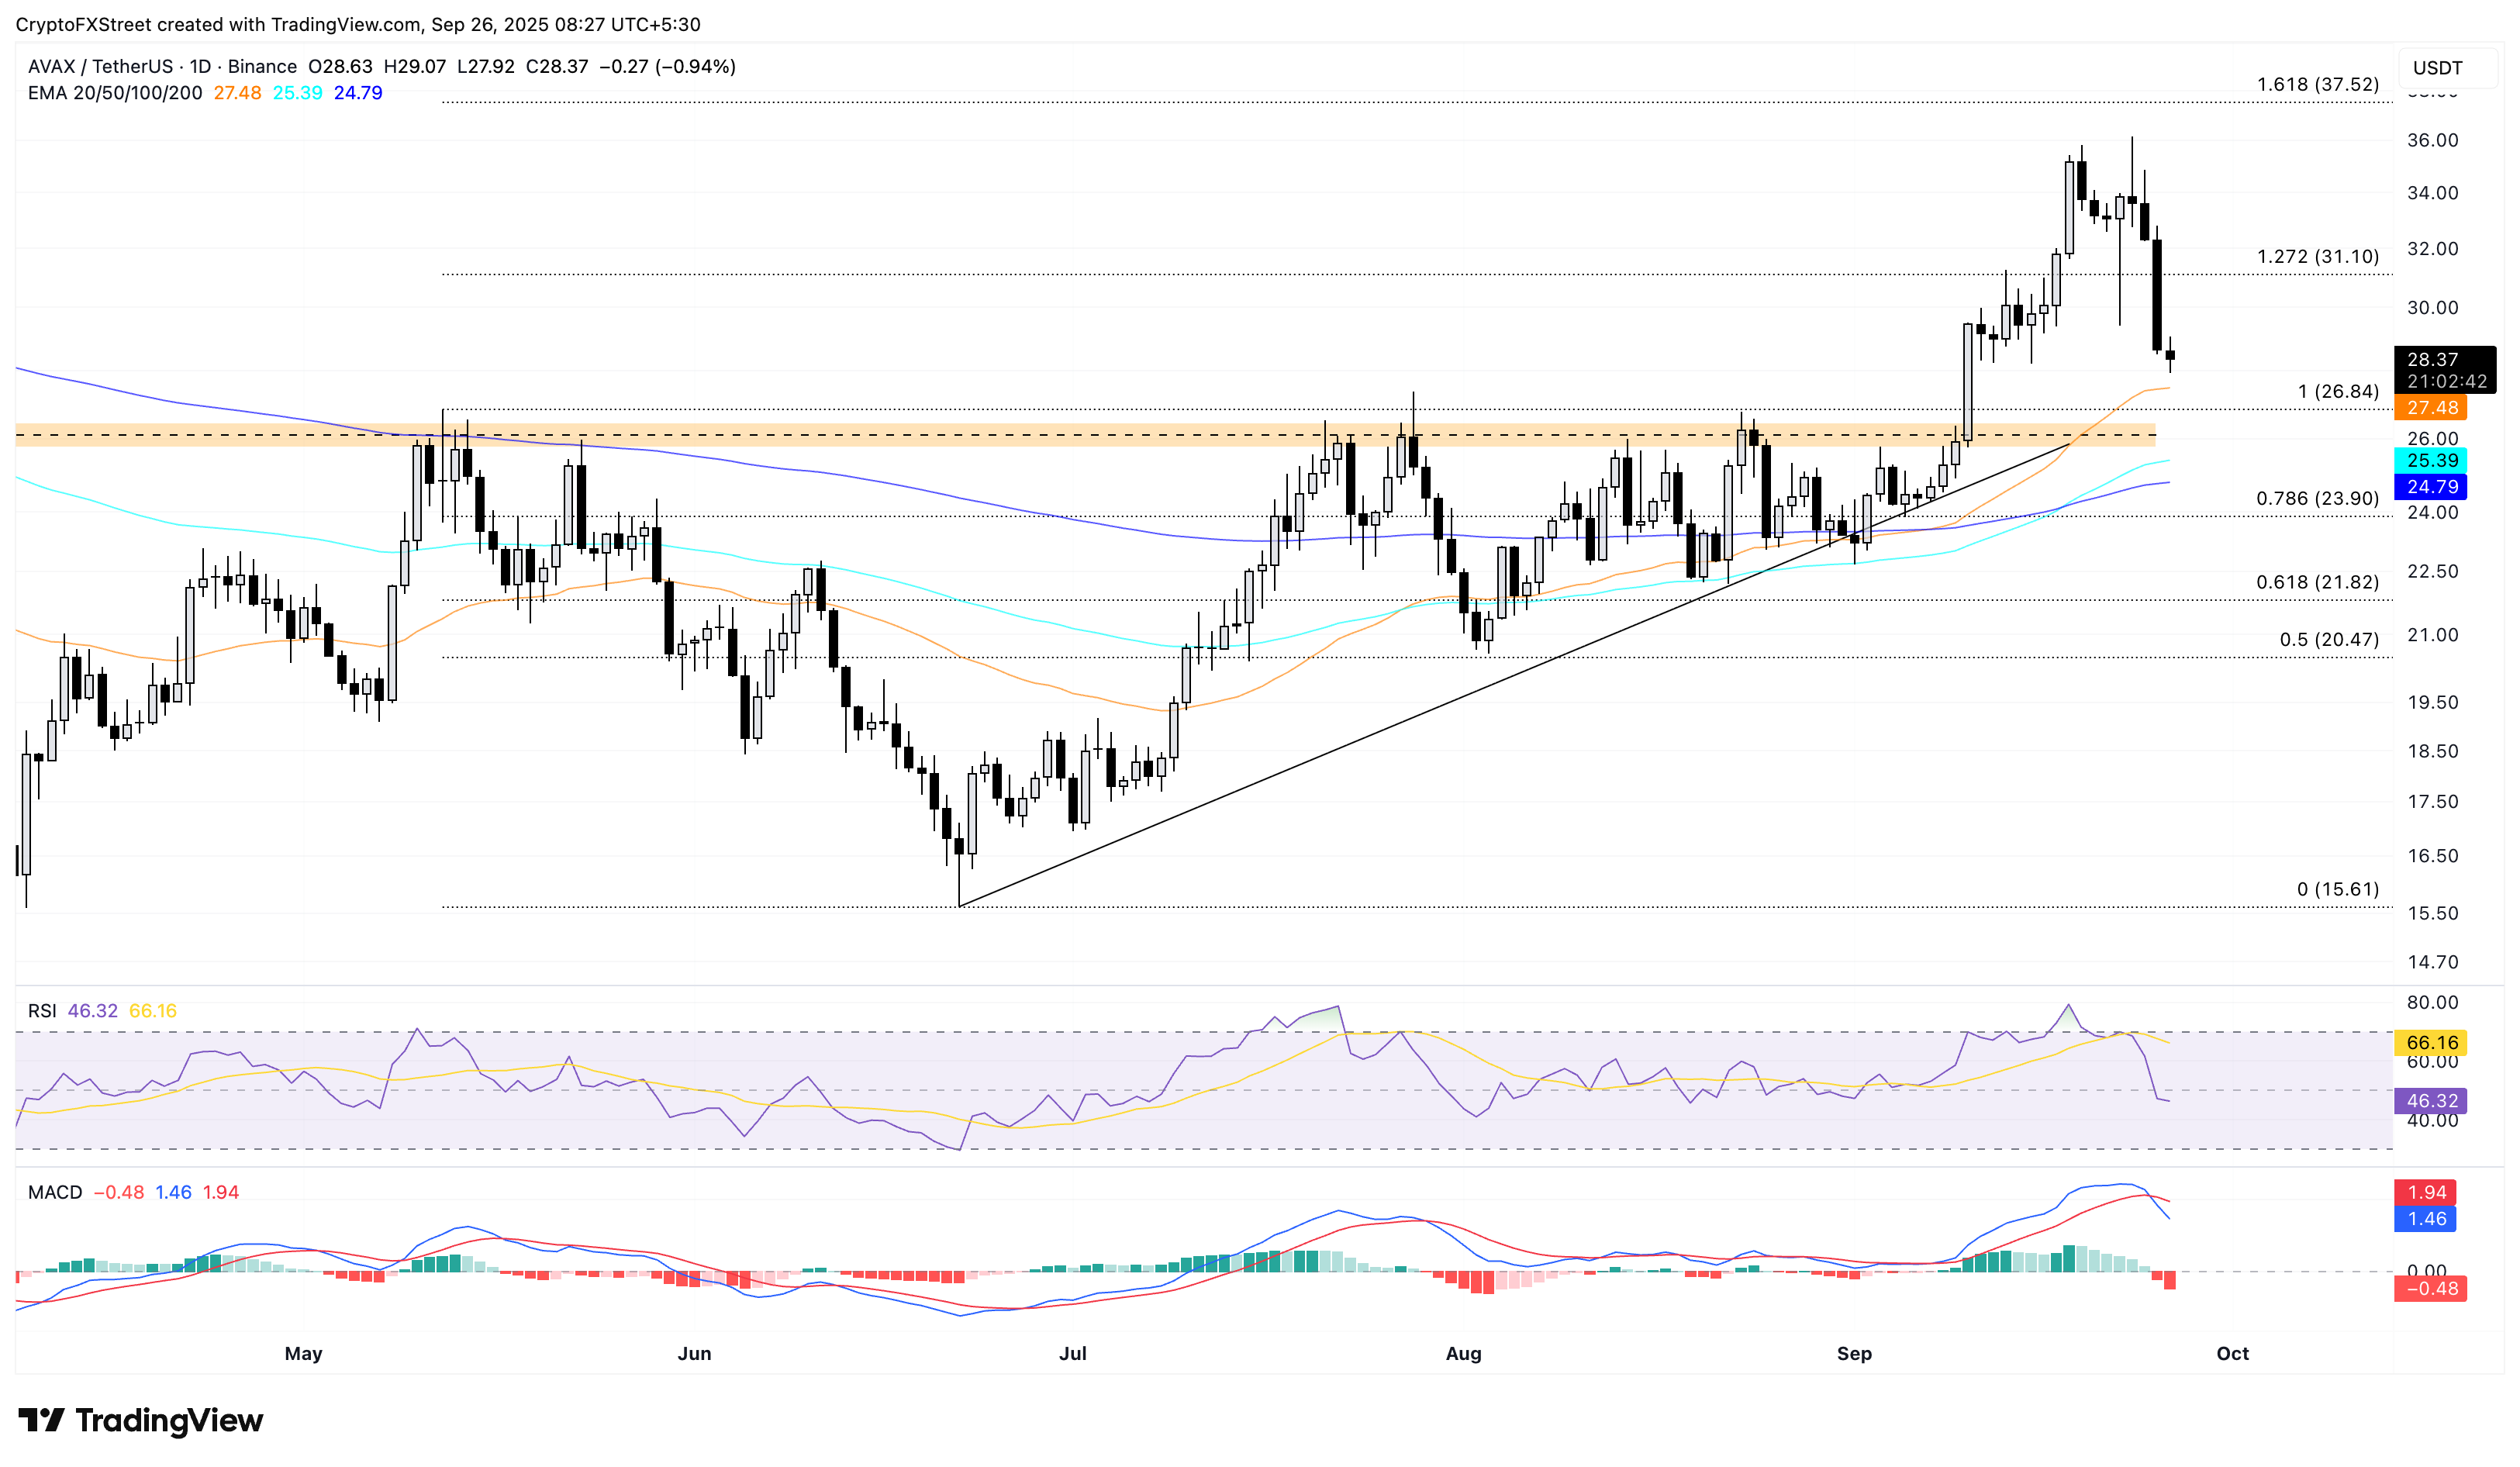
AVAX/USDT daily price chart.
If AVAX fails to hold above the 50-day EMA, it could extend the decline to the $26.84 level, followed by the 100-day EMA at $25.39.
Author

Vishal Dixit
FXStreet
Vishal Dixit holds a B.Sc. in Chemistry from Wilson College but found his true calling in the world of crypto.



