Solana (SOL/USD) faces sharp decline within wave C [Video]
![Solana (SOL/USD) faces sharp decline within wave C [Video]](https://editorial.fxsstatic.com/images/i/SOL-bearish-animal.png)
Solana (SOL/USD) is currently experiencing a sharp and impulsive decline, moving within wave C of a larger ABC corrective structure. This pattern suggests that the market is still in a corrective phase following the previous upward trend. Observing the price action closely, the current slow and sideways movement may belong to subwave "iv" of wave C, indicating that another leg down—subwave "v"—could push prices lower in the near term.
Based on the wave structure, SOLUSD could see further downside towards the 50 level before bulls are likely to return. This potential decline is part of the normal corrective process within the Elliott Wave framework and reflects a temporary weakening of buying momentum. Traders should remain cautious, as impulsive waves like wave C often unfold with strong moves and can trigger stop-losses if entered prematurely.
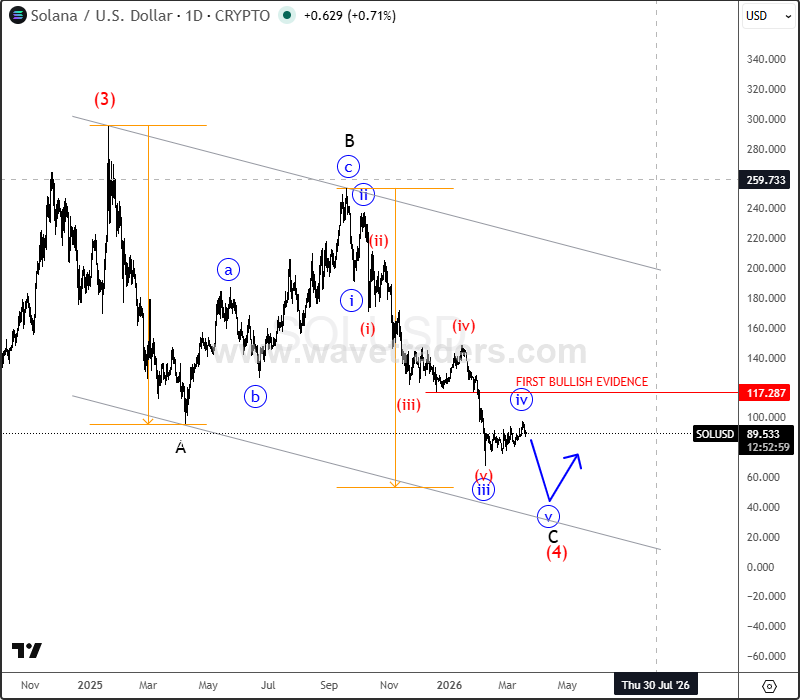
The first clear evidence of support and a potential bullish reversal will only appear if SOLUSD breaks above the 117 level. A move above this level would suggest the completion of the corrective structure and the possible start of a new upward trend. Until then, caution is warranted, as the market may continue to test lower support levels.
In conclusion, Solana is showing signs of further corrective weakness within the wave C pattern. Traders and investors should monitor subwave developments carefully, particularly looking for a decisive break above 117 for confirmation of a bullish reversal. Until that occurs, the dominant trend remains corrective, with potential downside targets around 50.
For more analysis like this, you can watch below our latest recording of a live webinar streamed on March 16:

Get Full Access To Our Premium Elliott Wave Analysis For 14 Days. Click here.
Author

Gregor Horvat
Wavetraders
Experience Grega is based in Slovenia and has been in the Forex market since 2003.


