Solana Price Forecast: SOL recovery at risk as institutions weigh long-term exposure
- Solana edges lower on Friday after a 2% fall the previous day, suggesting strong resistance above $90.
- Cumulative Solana ETF flows haven't fallen despite the token's price decline since their launch, highlighting committed institutional demand.
- Derivatives market holds a bearish outlook as both Solana futures Open Interest and funding rate fall amid intense long liquidations.

Solana (SOL) price edges lower below $90 at press time on Friday, following a 2% decline the previous day, and risks a bearish flip within a broader consolidation range. Data shows cumulative flow in Solana Exchange Traded Funds (ETFs) holds strong, reflecting committed institutional demand. Retail interest in Solana remains volatile, as a spike in long liquidations leads to positional unwinding in SOL derivatives and a negative funding rate. Technically, headwinds above $90 keep the recovery in check, risking a correction to $77.
Institutions shows long term commitment to Solana
Institutional demand for Solana remains strong since the launch of SOL-focused ETFs in the US market. Bloomberg analyst Eric Balchunas recently shared on his X account that the steady rise in cumulative inflows in Solana ETFs peaked at $1.45 billion on Tuesday, up from $0.41 billion on October 23.
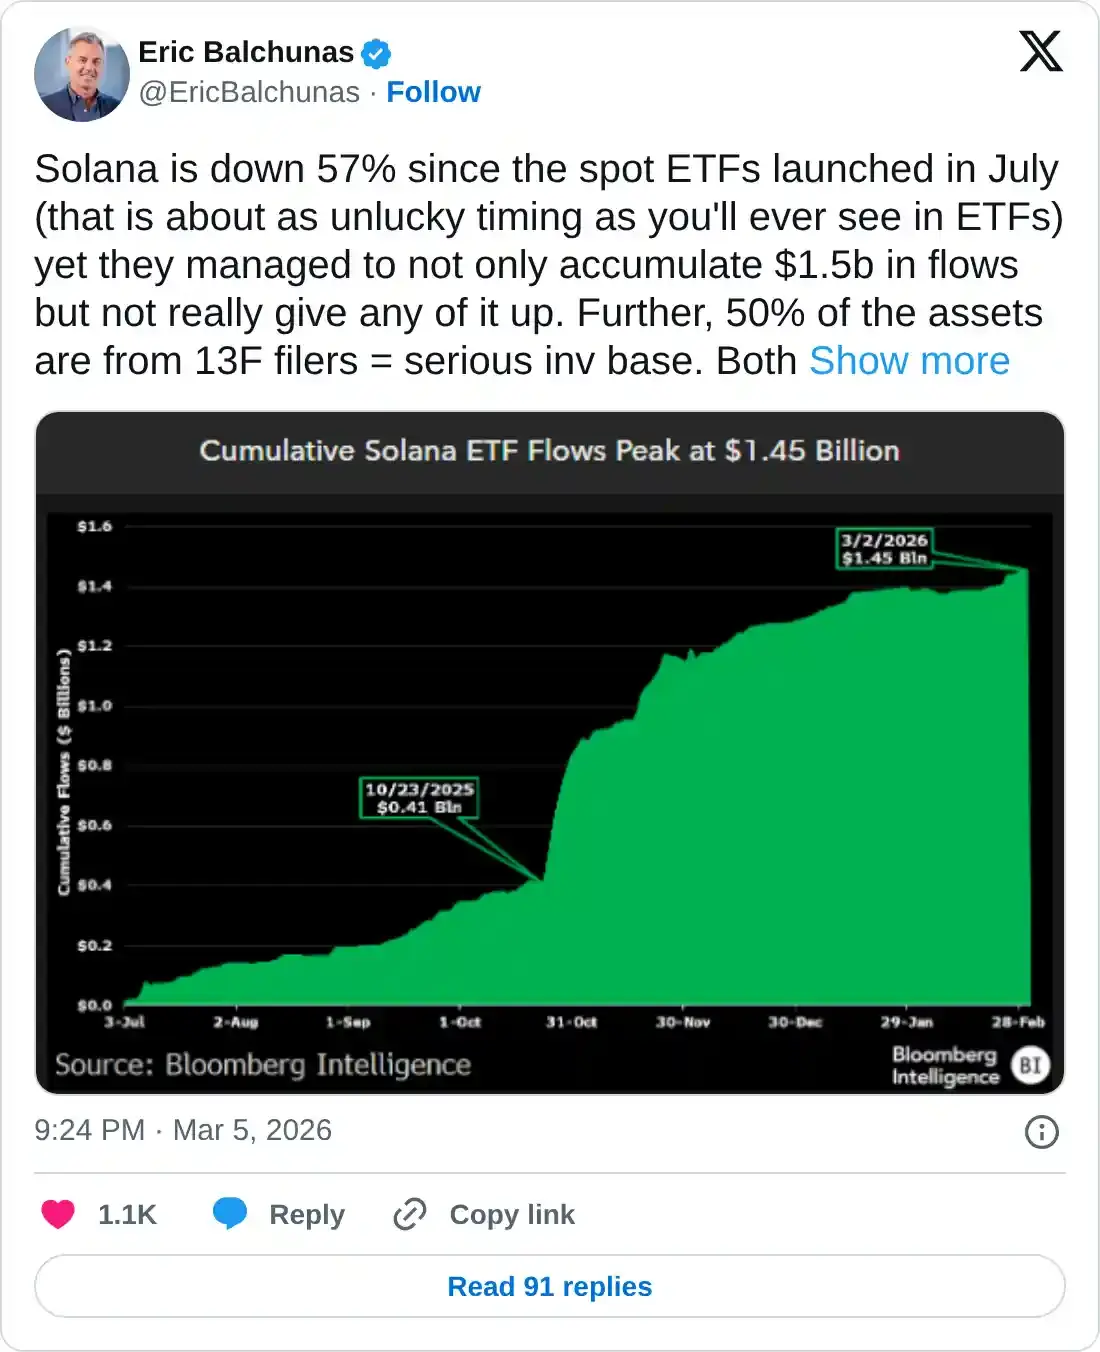
Meanwhile, minimal and occasional outflows, such as $5.23 million on Thursday, suggest that ETFs largely retain their holdings despite the SOL price falling below $100.
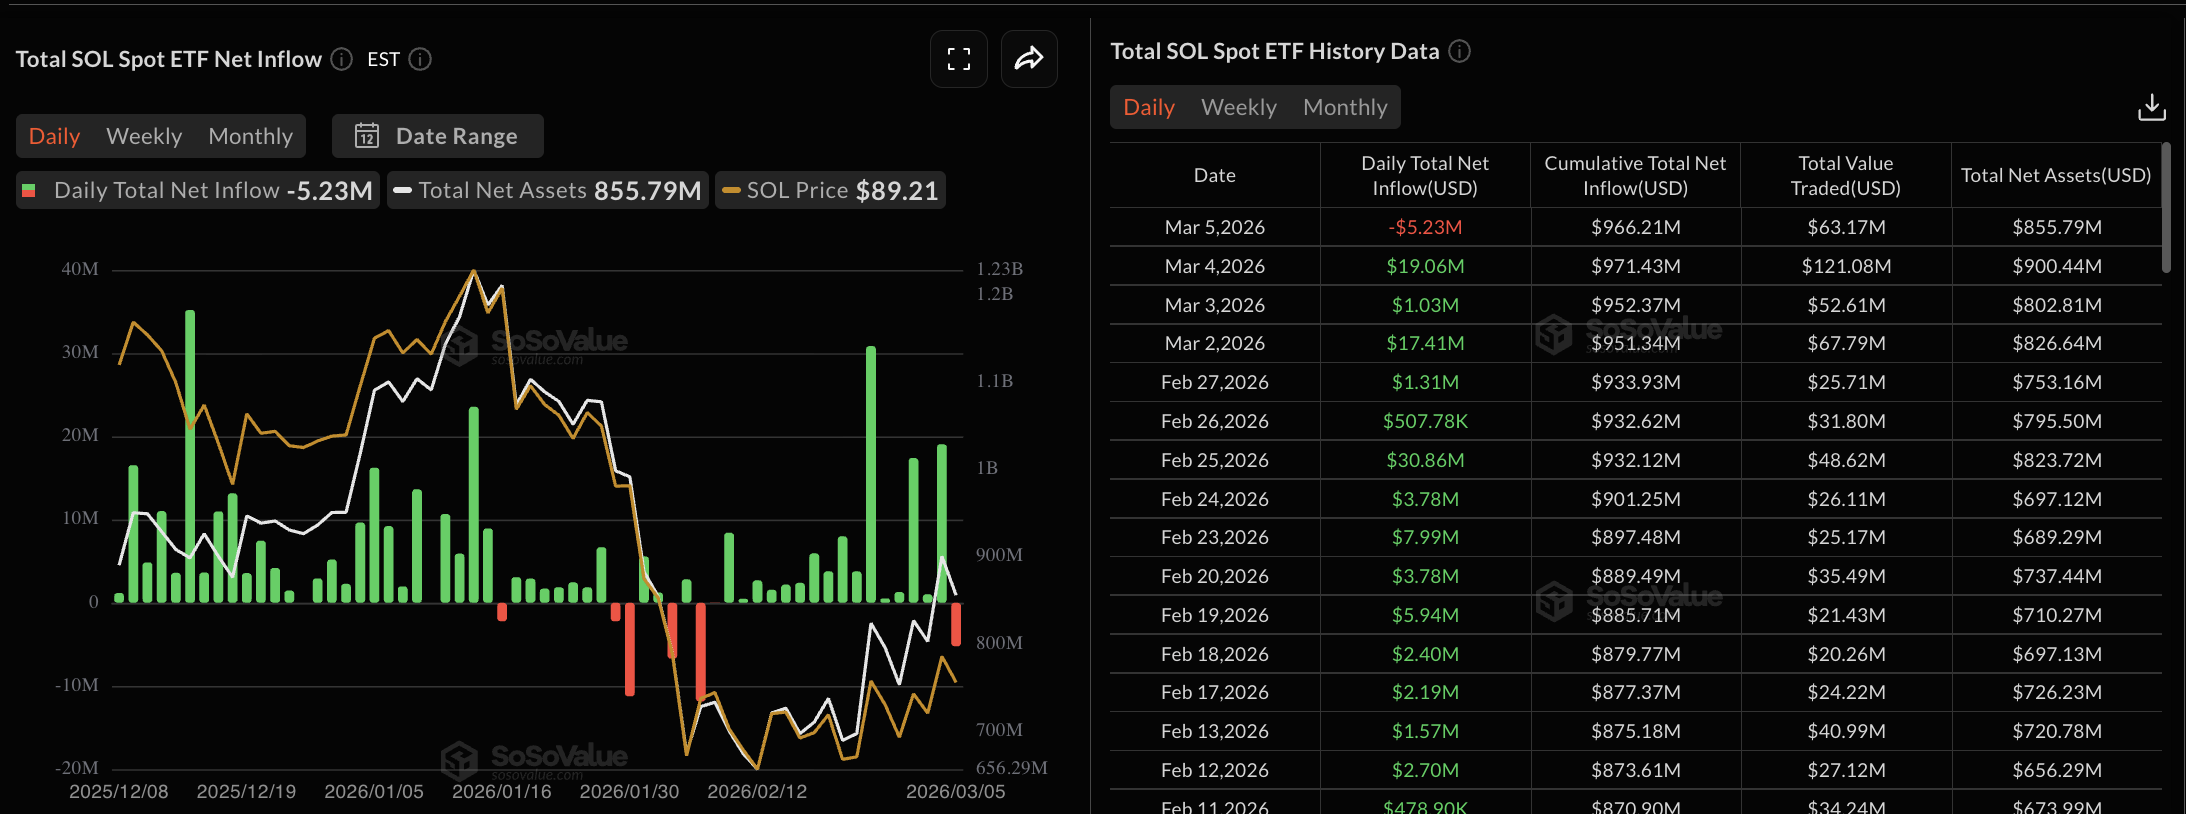
Balchunas further highlighted that the majority of these holdings stem from 13F filings, backed by institutional investors focused on the long term.
Derivatives data point to a weak retail audience
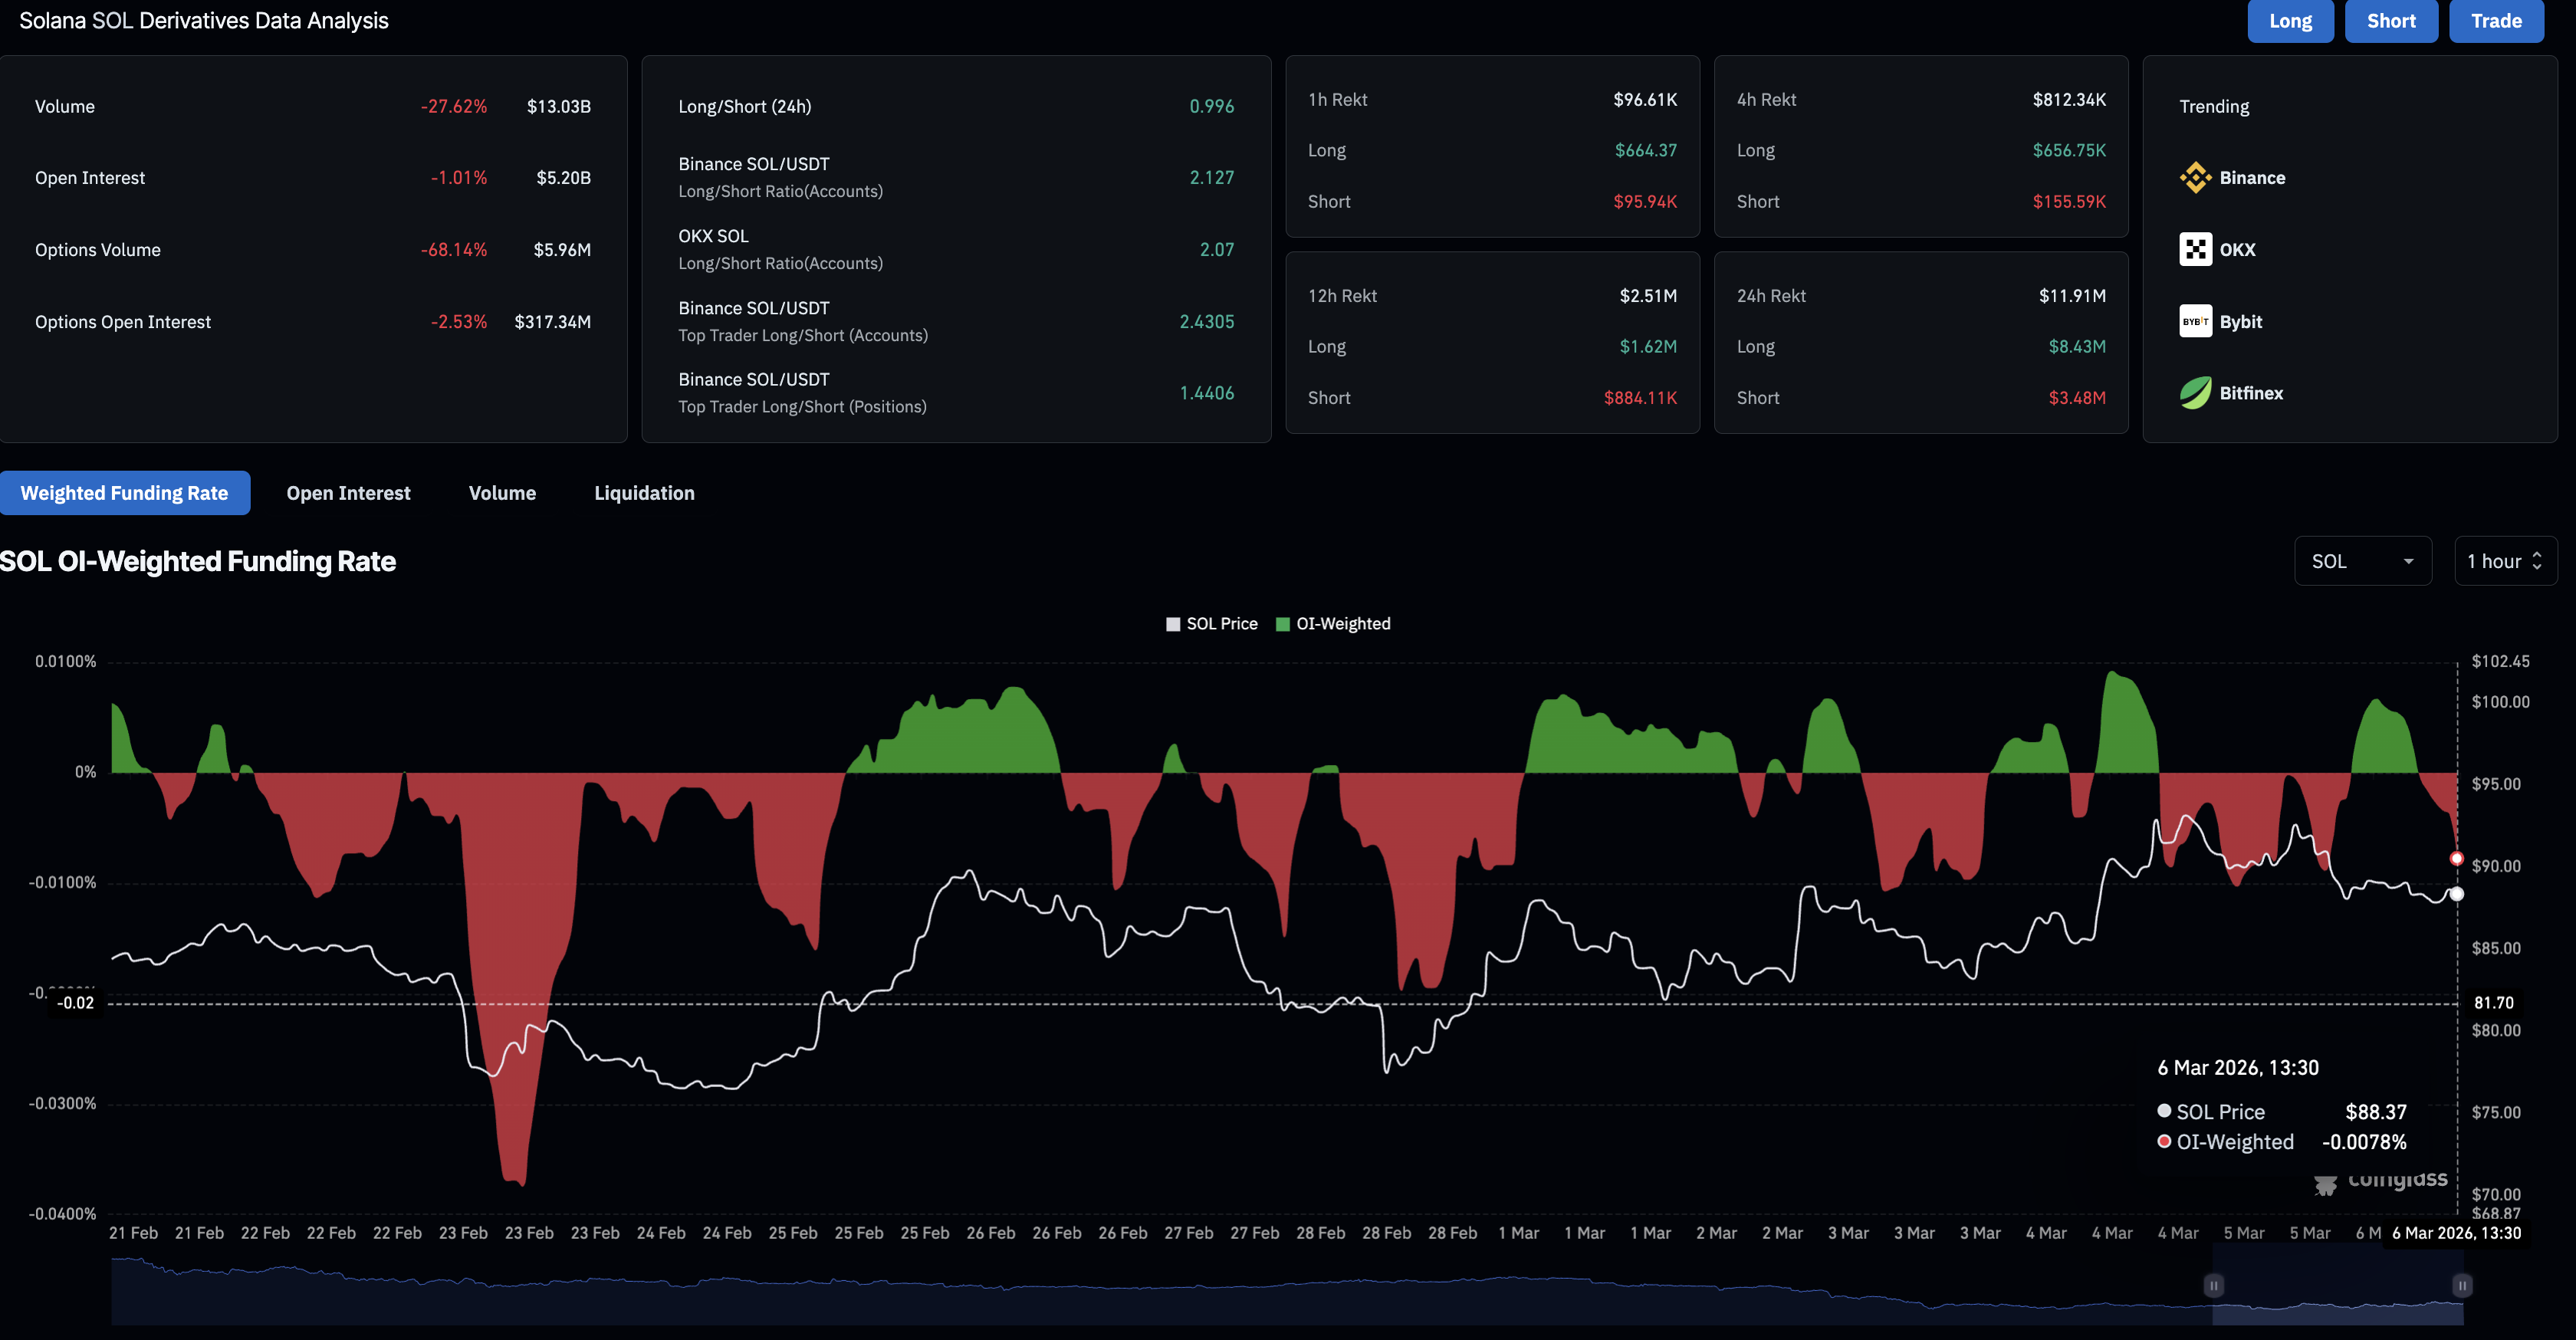
Retail confidence in Solana remains weak as Thursday’s pullback led to sharp liquidations. CoinGlass data shows $11.91 million of total liquidations over the last 24 hours, led by $8.43 million of long positions, suggesting a largely bullish positional wipeout. This dropped the long-to-short ratio to 0.996, which suggests a greater number of active bearish positions when below 1.
Consistent with the wipeout, the SOL futures Open Interest (OI) is down 1% in the same time period, to $5.20 billion, indicating a decline in positional building or leverage exposure as risk-on sentiment fades. Additionally, the funding rate has dropped to -0.0078%, from 0.0067% earlier on Friday, reflecting a sharp increase in bearish interest among traders.
Technical outlook: Will Solana break its consolidation range?
Solana edges below $88.00 at press time on Friday, extending Thursday’s 2% loss. The medium-term outlook for Solana is mildly bearish as it trades below the downward-sloping 50-day, 100-day, and 200-day Exponential Moving Averages (EMAs), which continue to cap the upside.
The pullback in SOL extends consolidation within the February 5 candle, ranging from $92.11 to $78.35. Based on previous pullbacks within this range, Solana is likely to test the $78.35 level. However, a daily close below this level could further extend the downside to the February 6 low at $67.50.
The technical indicators on the daily chart suggest moderate downside momentum as Solana reverses below $90. The Moving Average Convergence Divergence (MACD) remains above the signal line in the negative territory, while the MACD histograms contract, hinting at a fading bullish impulse. At the same time, the Relative Strength Index (RSI) has slipped back to 47, below the midline, reinforcing a neutral-to-bearish tone.
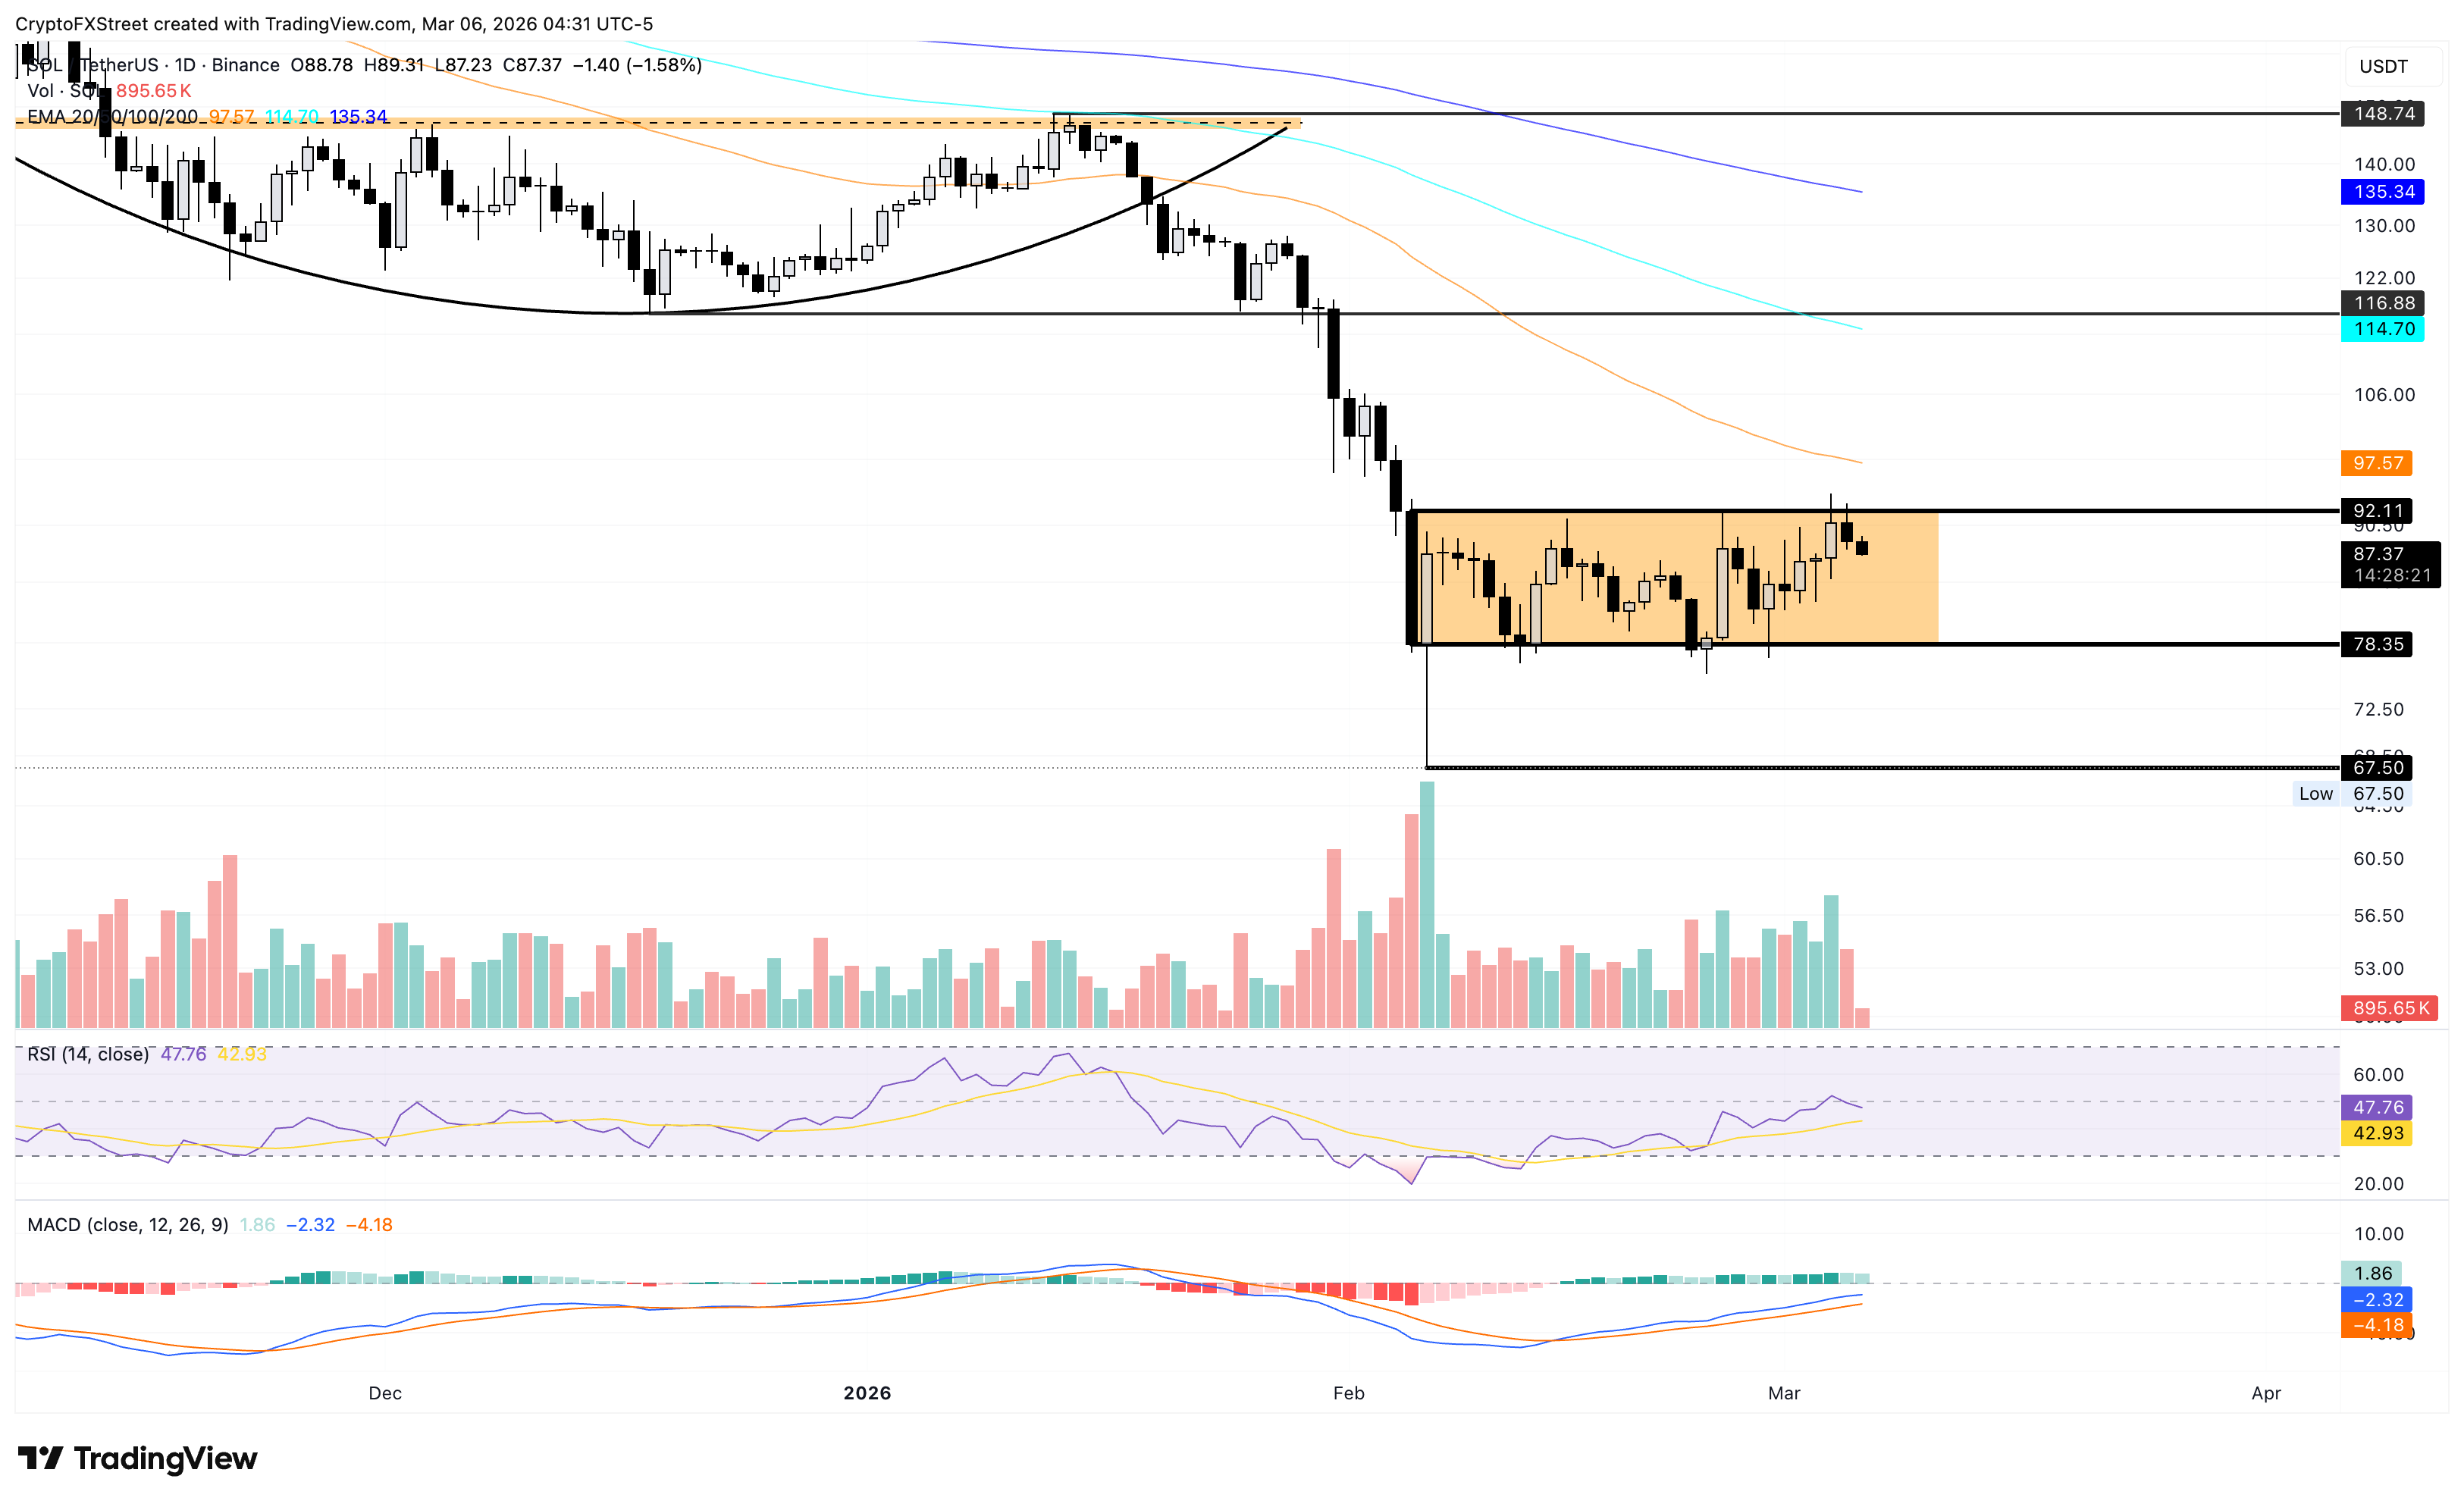
For sustained recovery, Solana should secure a daily close above $92.11, which could face resistance at the 50-day EMA at $97.57 and the $100 psychological level. Beyond this, the 100-day EMA at $114.70 remains a higher target level.
(The technical analysis of this story was written with the help of an AI tool.)
Author

Vishal Dixit
FXStreet
Vishal Dixit holds a B.Sc. in Chemistry from Wilson College but found his true calling in the world of crypto.