Solana Price Forecast: Mixed sentiment caps upside move
- Solana extends its correction trading below $72 on Thursday after falling over 2.5% in the last two days.
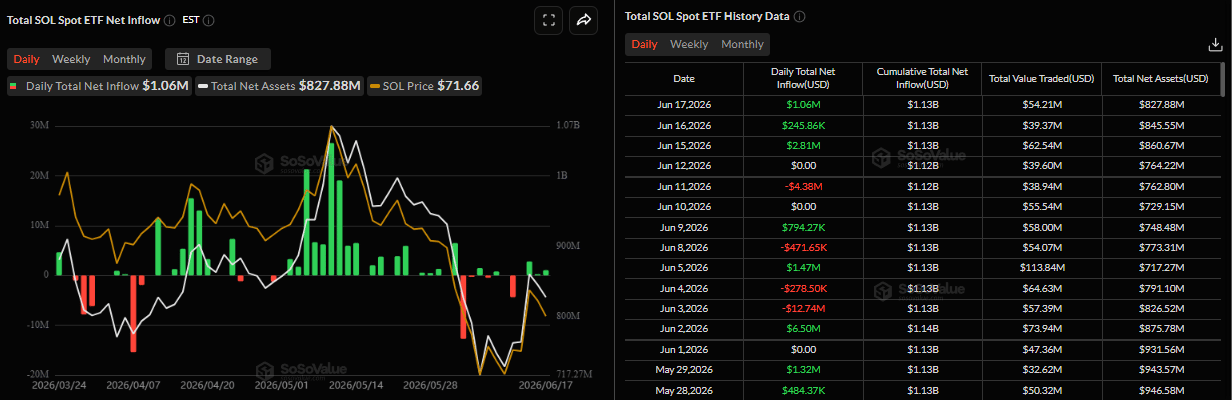
- US-listed spot ETFs recorded an inflow of $1.06 million on Wednesday, marking the third consecutive day of inflow this week.
- Derivatives data supports a bearish bias, as with negative funding rates and rising short bets.

Solana (SOL) extends its decline, trading below $72 on Thursday after losing over 2.5% in the last two days. Institutional demand shows mild optimism as spot Exchange Traded Funds (ETFs) recorded an inflow of $1.06 million on Wednesday, marking the third consecutive day of inflow so far this week. Despite these positive flows, derivatives metrics continue to cap SOL’s upside move.
Institutional demand shows some signs of optimism
Institutional demand continues to strengthen so far this week. SoSoValue data showed that spot Solana ETFs recorded an inflow of $1.06 million on Wednesday, after two consecutive days of positive flow. If inflows continue to strengthen throughout the week, SOL could see further recovery ahead.
Derivatives metrics cap SOL
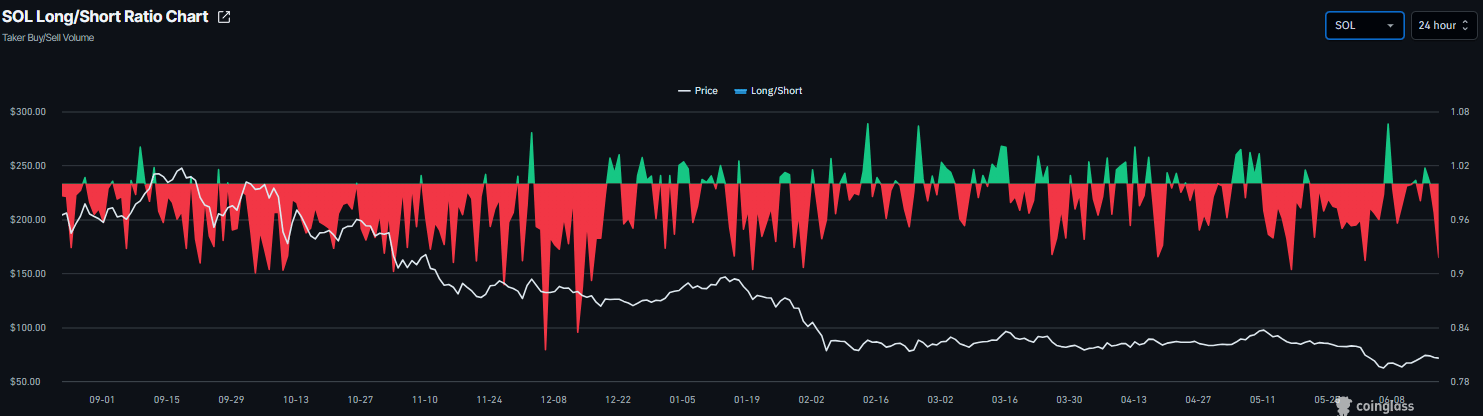
On the derivatives side, metrics support bearish sentiment among traders and cap SOL's potential upside. CoinGlass’ long-to-short ratio for SOL read 0.91 on Thursday, nearing the lowest level over a month. The ratio being below one, indicates bearish sentiment, as traders are betting the assets’ prices will fall.
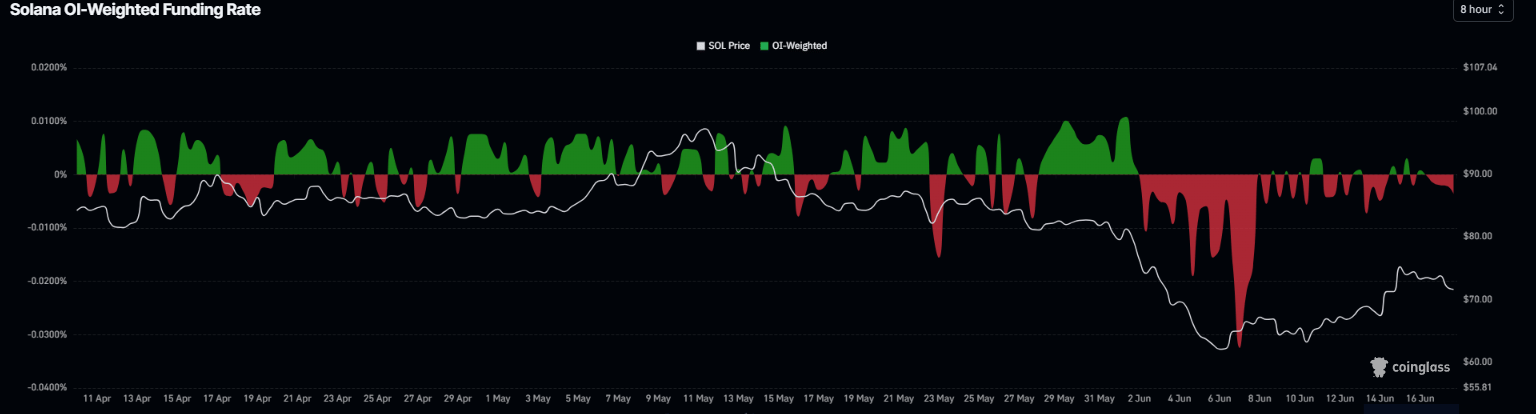
In addition, the funding rates turned negative on Tuesday, reading -0.0036% on Thursday, indicating that shorts are paying longs and projecting bearish sentiment.
Solana Price Forecast: Faces rejection from key resistance zone
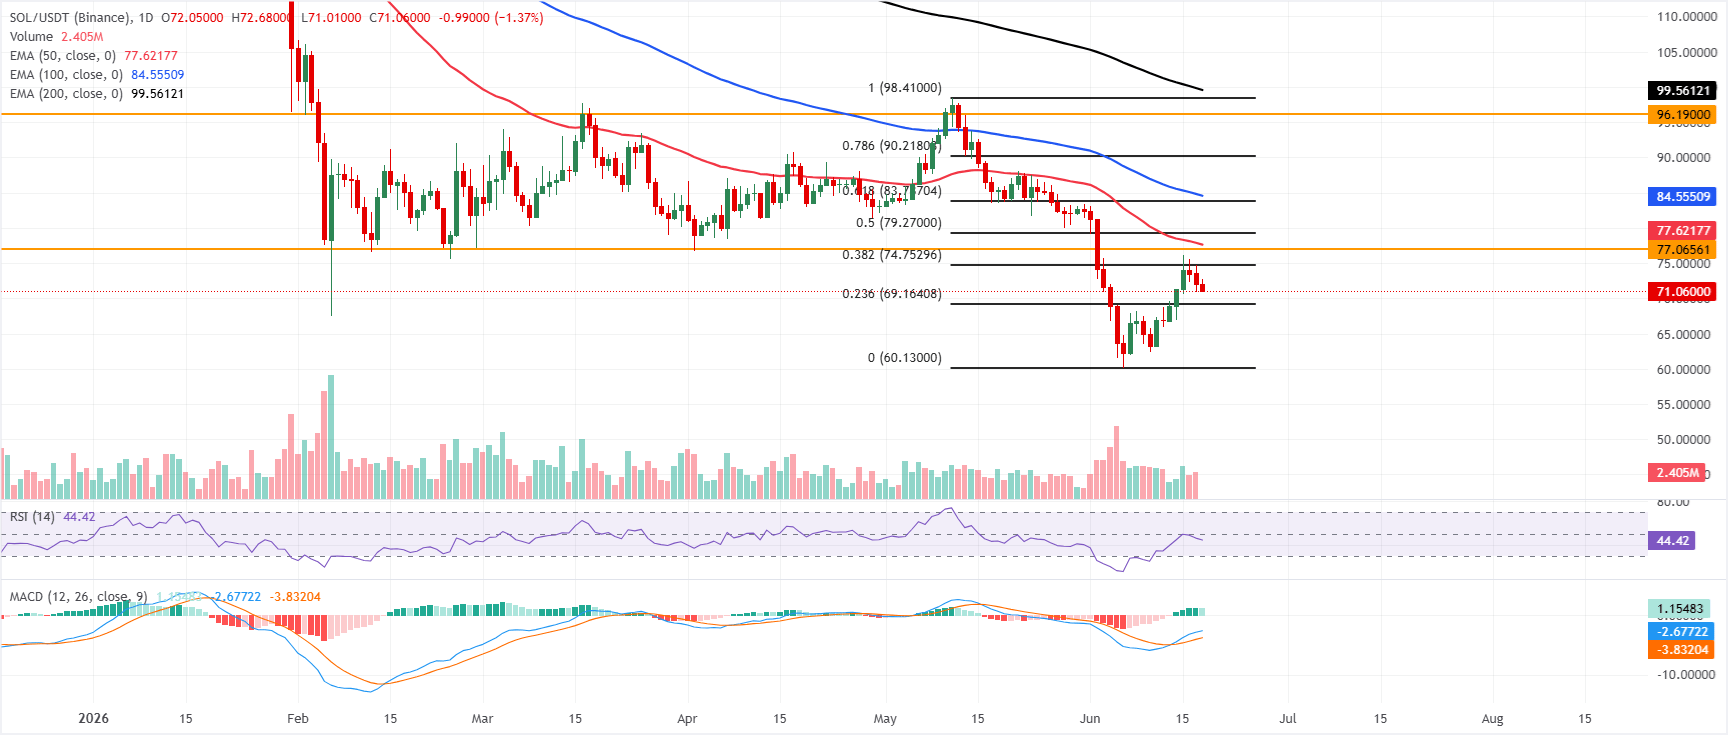
Solana price trades at $71.01 on Thursday, after correcting slightly in the previous two days. SOL is maintaining a bearish near-term bias as it holds below the 50-day, 100-day and 200-day Exponential Moving Averages (EMAs), clustered well above price and reinforcing a capped structure.
The Relative Strength Index (RSI) on the daily chart, at around 44, indicates slightly negative momentum despite a recovery from oversold territory. At the same time, the Moving Average Convergence Divergence (MACD) remains in positive territory but suggests only a modest rebound within a broader corrective phase.
On the topside, initial resistance is seen at the 38.2% Fibonacci retracement near $74.75, ahead of a tighter barrier formed by the horizontal level at $77.07 and the 50-day EMA around $77.62, with the 50% retracement at $79.27 adding to this supply zone. Further up, the 61.8% Fibonacci level at $83.79 and the 100-day EMA near $84.55 act as the next caps before stronger overhead resistance at $90.22, $96.19, and the $98.41 Fibonacci high, backed by the 200-day EMA near $99.56.
On the downside, immediate support emerges at the 23.6% retracement around $69.16, with the cycle low near $60.13 providing a more significant floor if selling pressure resumes.
(The technical analysis of this story was written with the help of an AI tool.)
Author

Manish Chhetri
FXStreet
Manish Chhetri is a crypto specialist with over four years of experience in the cryptocurrency industry.




