Shiba Inu Price Forecast: SHIB declines despite 83 million token burn as demand wanes
- Shiba Inu is down nearly 2% on Monday, extending its 7% decline from the previous week.
- Over 83 million SHIB tokens were burned on Sunday, suggesting easing supply-side pressure.
- Declining SHIB Open Interest and easing funding rates suggest waning retail demand.

Shiba Inu (SHIB) price is down nearly 2% on Monday, after two consecutive days of recovery, extending last week's 7% decline. Declining SHIB futures Open Interest and the funding rate offset the 83 million SHIB tokens burned on Sunday, implying potential downside. The technical outlook for SHIB is mixed, with momentum maintaining a recovering tone.
Retail demand eases despite 83 million SHIB tokens burned
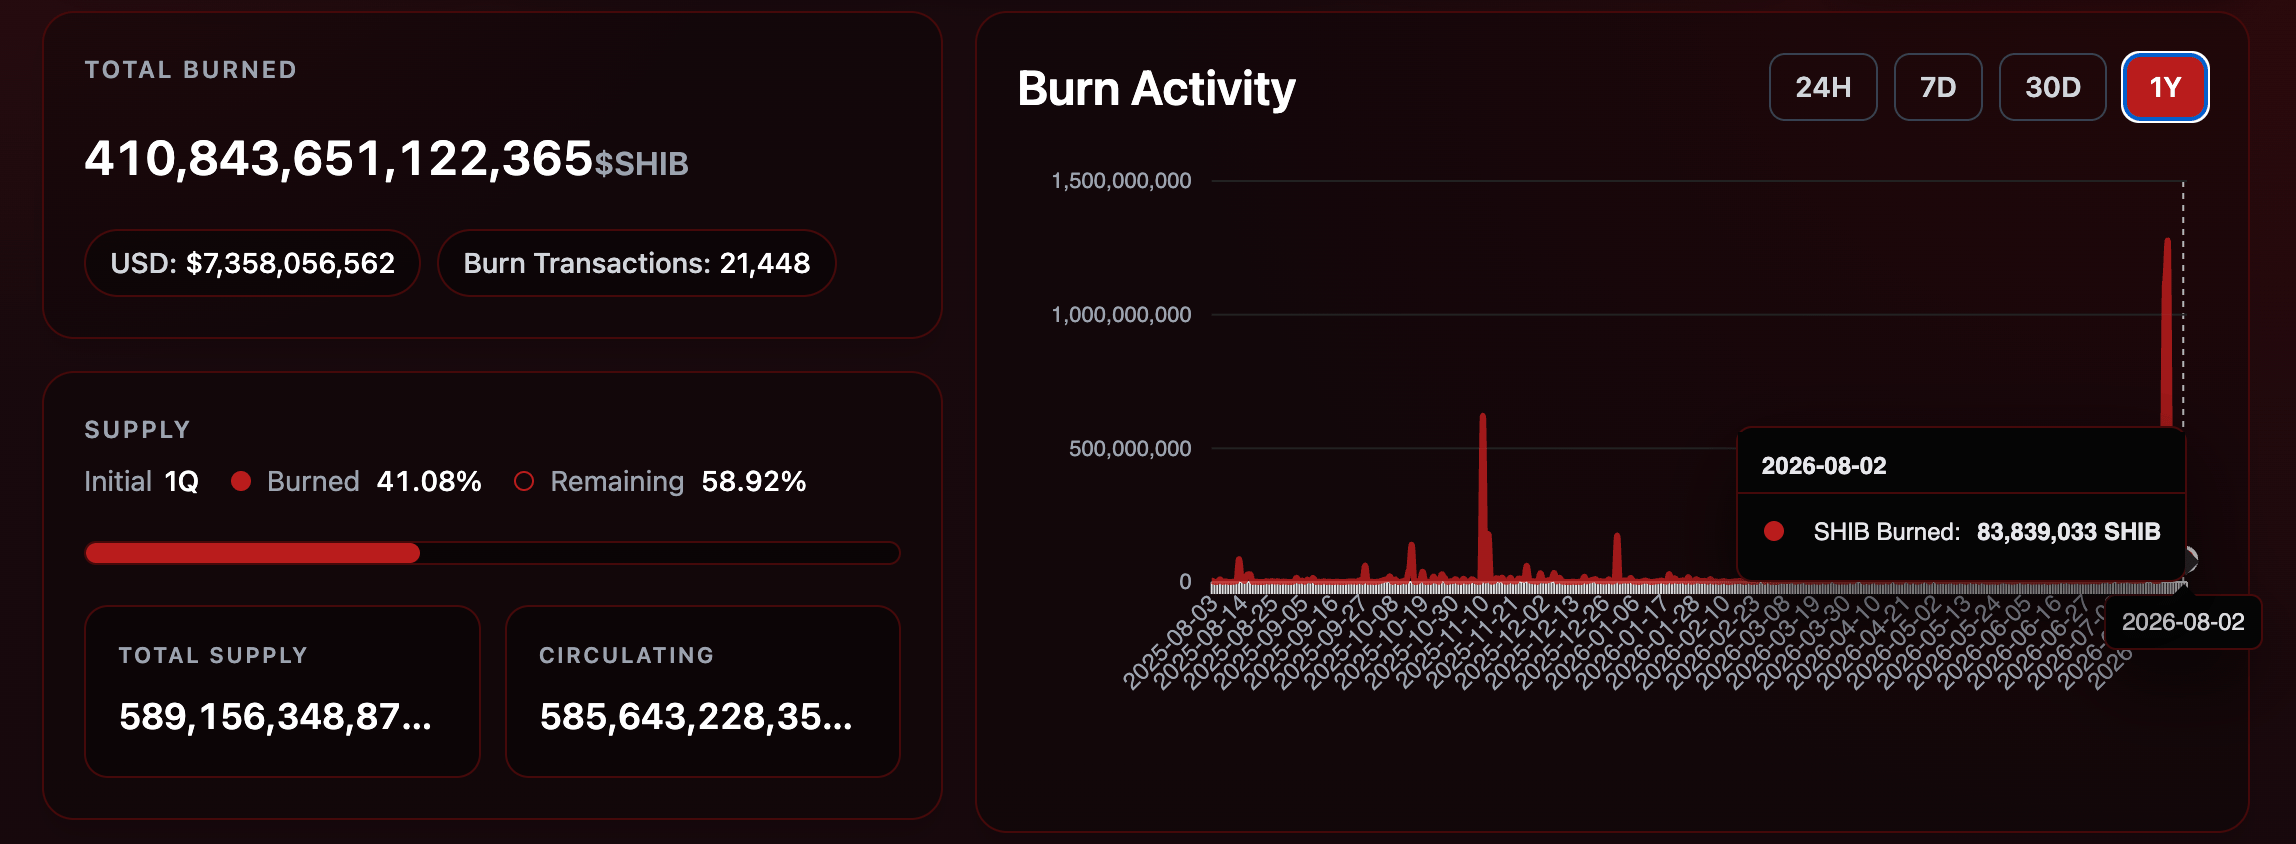
Shiba Inu loses retail strength in the near term, offsetting the recent spike in token burn. Shibburn data shows that 83.83 million SHIB tokens were burned on Sunday, reducing the available supply and often implying reduced selling pressure. However, retail sentiment remains bearish in the near term.
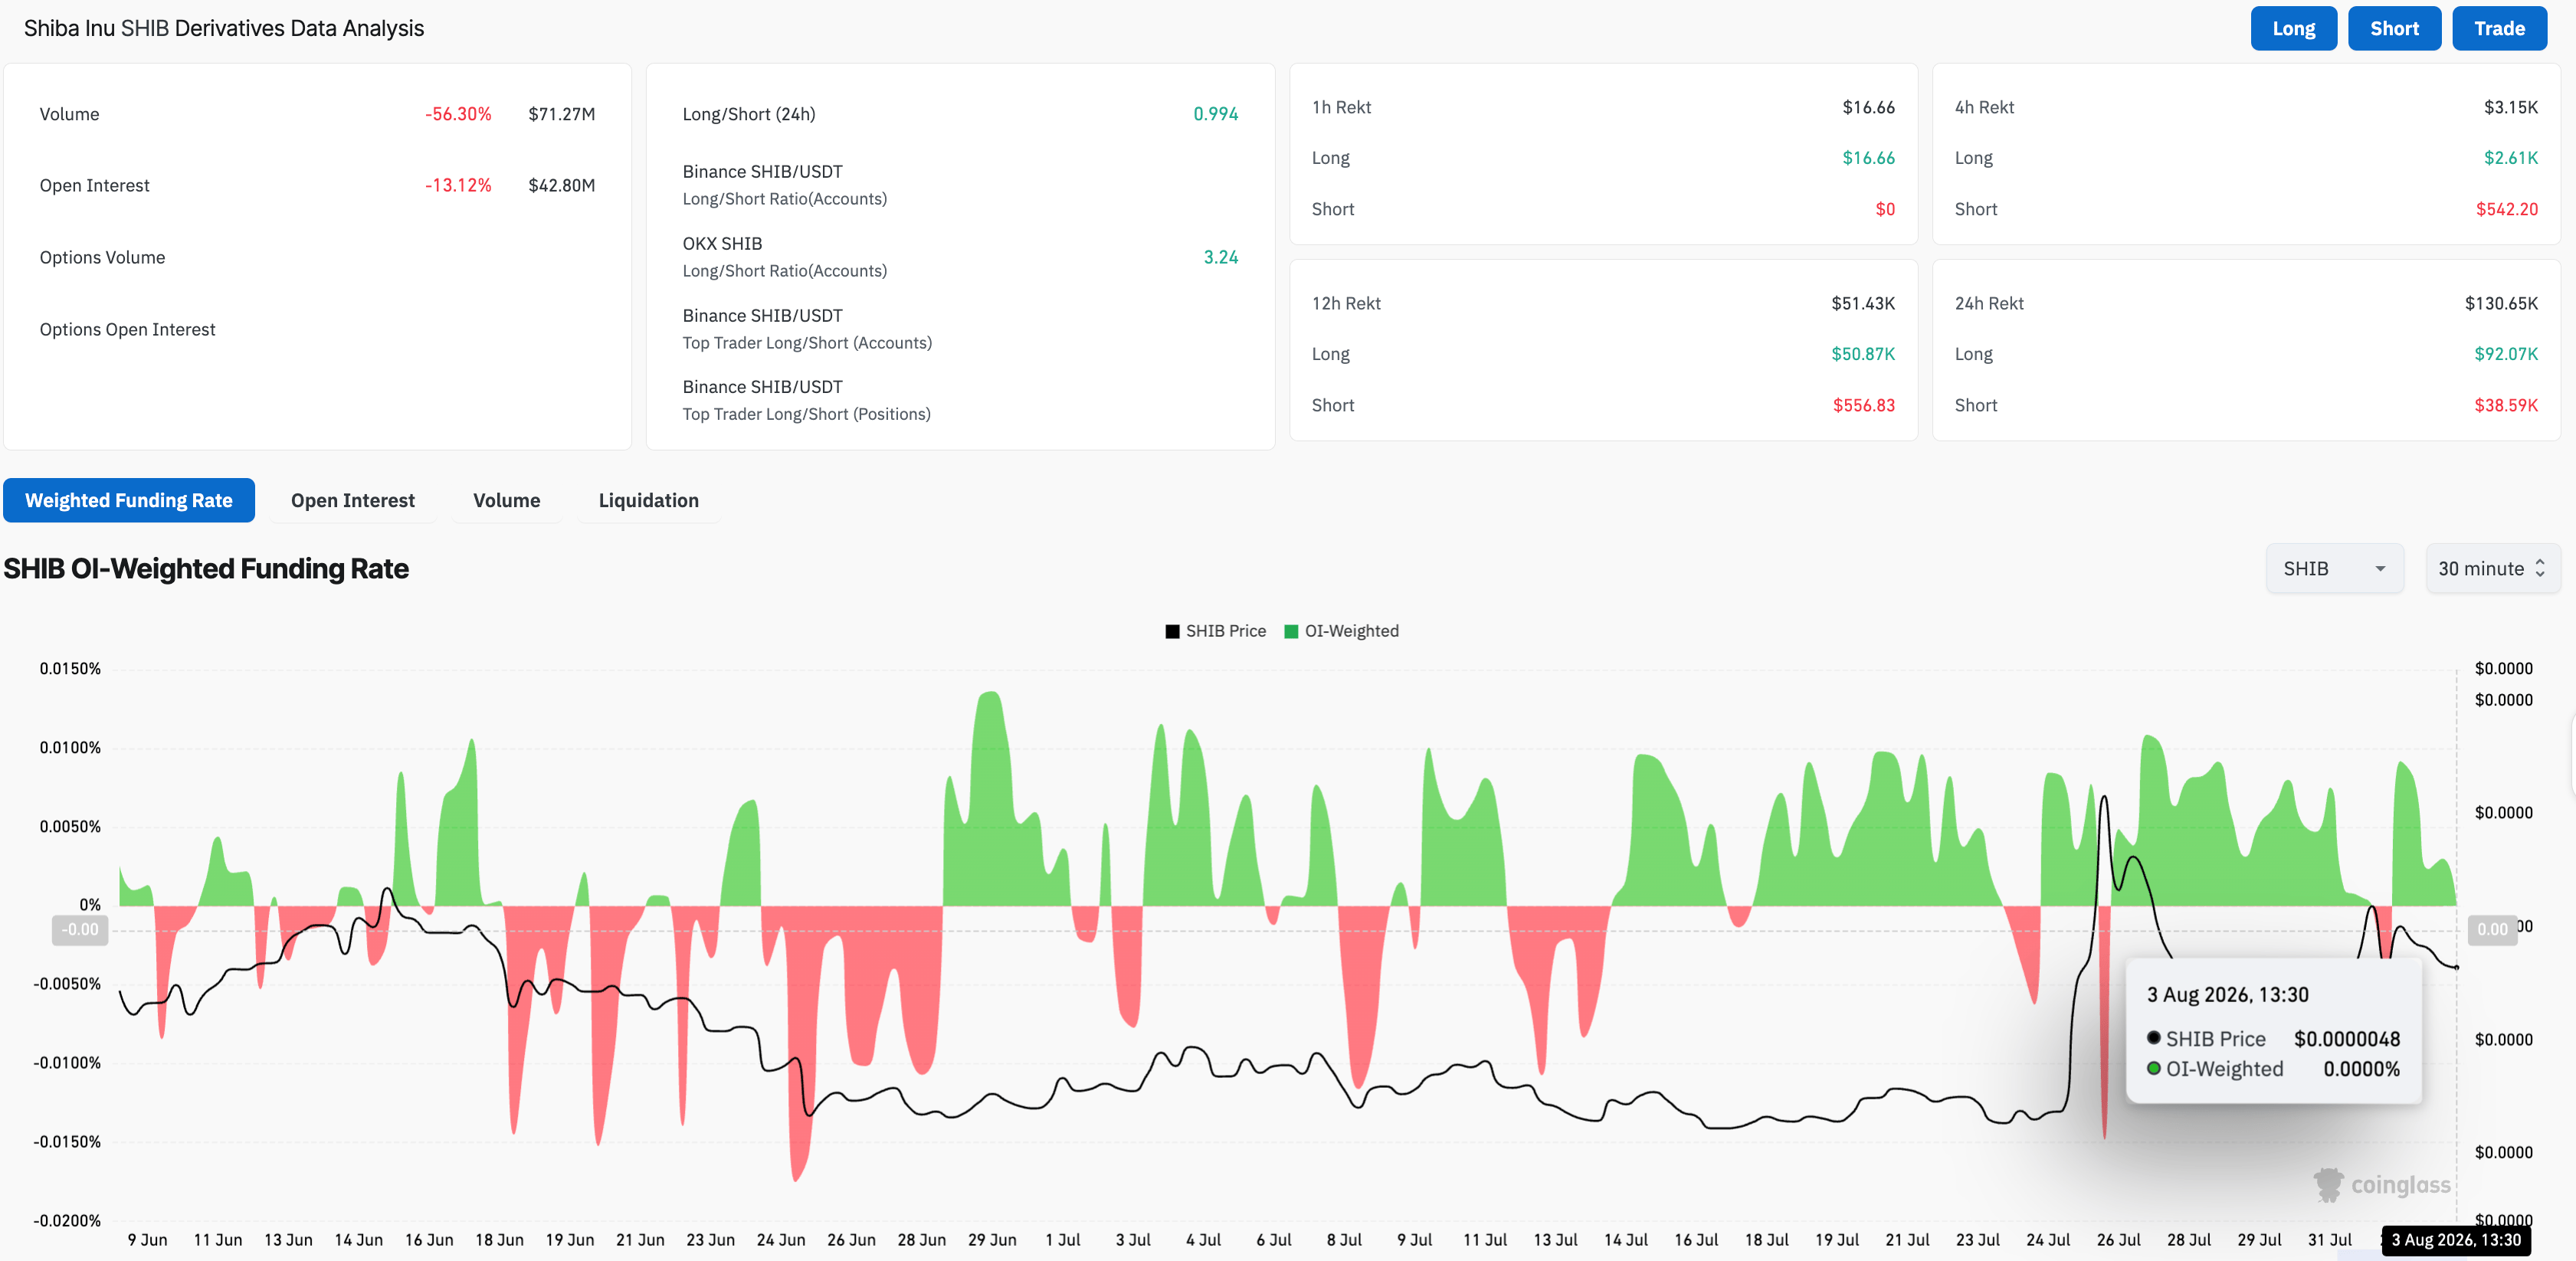
CoinGlass data shows SHIB Open Interest (OI) is down 13% over the last 24 hours to $42.80 million, implying reduced positional buildup. At the same time, the volume has dropped 56% to $71.27 million, with the funding rate down to 0% from 0.0092% the previous day, together suggesting reduced retail activity and bullish sentiment.
Technical outlook: Will SHIB price extend its decline?
Shiba Inu edges lower on Monday, after two consecutive days of recovery, as price faces headwinds near the $0.00000500 psychological threshold. The meme coin maintains a near-term recovery tone, holding above the 78.6% Fibonacci retracement level, measured from the $0.00000670 high to $0.00000405 low, at $0.00000462.
The immediate overhead resistance for SHIB is at the 50% retracement level at $0.00000538. A decisive close above this level could reinstate a bullish reversal targeting the 23.6% retracement level at $0.00000607.
The Relative Strength Index (RSI) at 57, maintains a neutral to bullish tone as it consolidates slightly above its midline. Meanwhile, the Moving Average Convergence Divergence (MACD) holds above its signal line as the positive histograms decline, reaffirming a neutral tone.
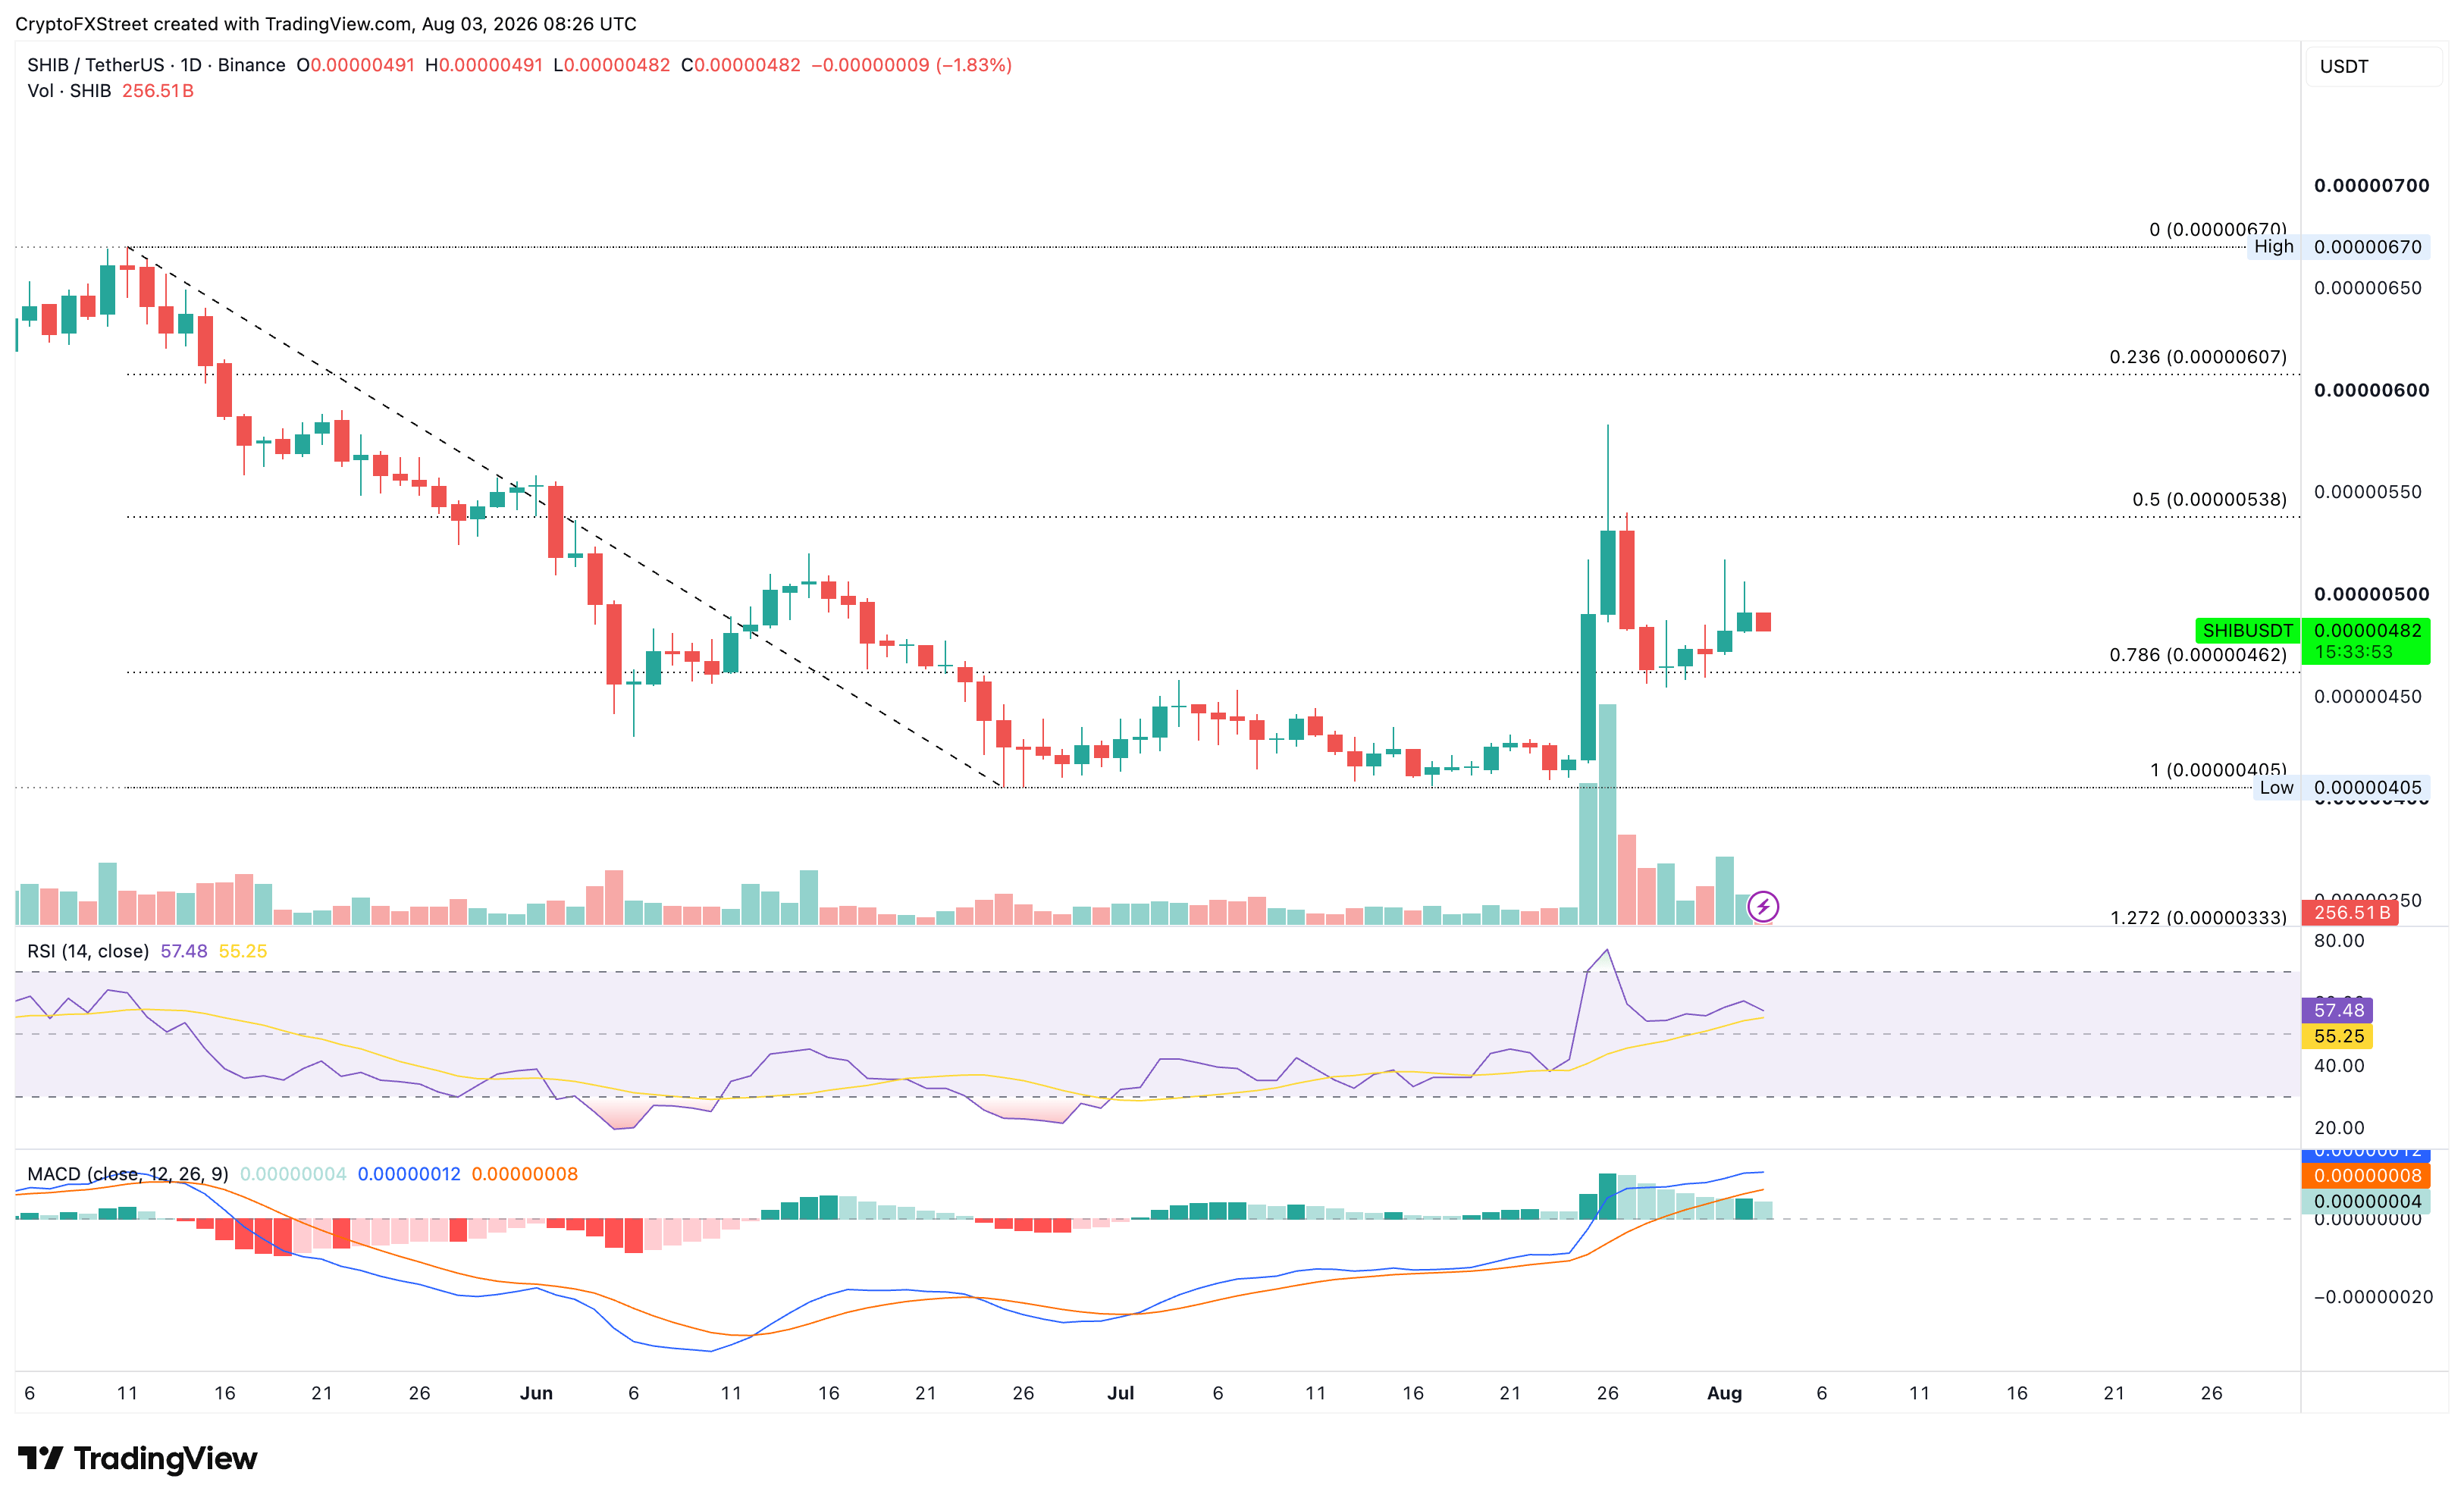
Looking down, a slip below the 78.6% retracement level at $0.00000462 could target the previous swing low at $0.00000405.
(The technical analysis of this story was written with the help of an AI tool. Know more.)
Author

Vishal Dixit
FXStreet
Vishal Dixit holds a B.Sc. in Chemistry from Wilson College but found his true calling in the world of crypto.



