Shiba Inu Price Forecast: SHIB attempts recovery as bullish positioning climbs to monthly high
- Shiba Inu price steadies at $0.0000056 on Wednesday after recovering nearly 7% in the previous two days.
- Metrics support a bullish bias with trading volume rising and long positions climbing to the highest level in over a month.
- The technical outlook suggests a potential rebound as momentum indicators show early signs of a fading bearish trend.
Shiba Inu (SHIB) price hovers at $0.0000056 as of writing on Wednesday, after posting a nearly 7% rebound over the past two days. The ongoing recovery comes as on-chain and derivatives data turn supportive, with trading volume increasing and long positions climbing to their highest level in more than a month.
Meme coin SHIB looks promising
Santiment data indicates that the Shiba Inu ecosystem’s trading volume (the aggregate trading volume generated by all exchange applications on the chain) reached $214.28 million on Wednesday, the highest trading volume not seen since February 6. This volume rise indicates a surge in traders’ interest and liquidity in the dog-themed meme coin, boosting its bullish outlook.
 [09-1773205414211-1773205414212.23.05, 11 Mar, 2026].png)
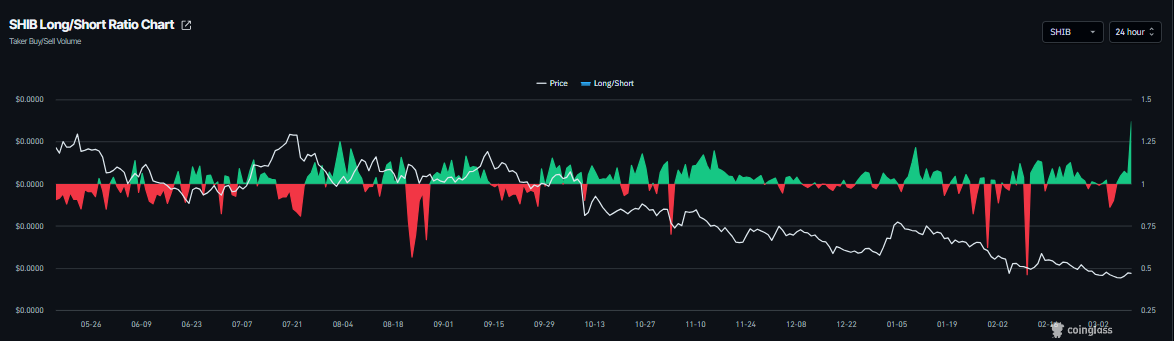
On the derivatives side, CoinGlass’s long-to-short ratio for SHIB reads 1.36 on Wednesday, the highest level over a month. The ratio above one suggests that more traders are betting on Shiba Inu’s price to rally.
Despite rising trading volume and long bets, SHIB Army should remain cautious, as CryptoQuant’s summary data shows mixed conditions. Activity across both spot and futures markets suggests a slightly optimistic outlook for SHIB, with large whale orders and buy-side dominance in the spot market. However, overheating conditions on the spot market alongside sell-side dominance in the futures market reflect negative sentiment among investors.

Shiba Inu Price Forecast: Momentum indicators show signs of fading bearish strength
Shiba Inu closed above the daily resistance at $0.0000054 on Monday and rose by 4% the next day. As of writing on Wednesday, SHIB is trading at $0.0000056.
If SHIB continues its recovery, it could extend the gains toward the 50-day EMA at $0.0000063. A close above this level could extend the rally toward the weekly resistance at $0.0000067.
The Relative Strength Index (RSI) on the daily chart is 43, pointing upward toward the neutral 50 level, indicating fading bearish momentum. For the recovery rally to be sustained, the RSI must move above the neutral level. The Moving Average Convergence Divergence (MACD) shows a bullish crossover on Tuesday, further supporting the recovery thesis.
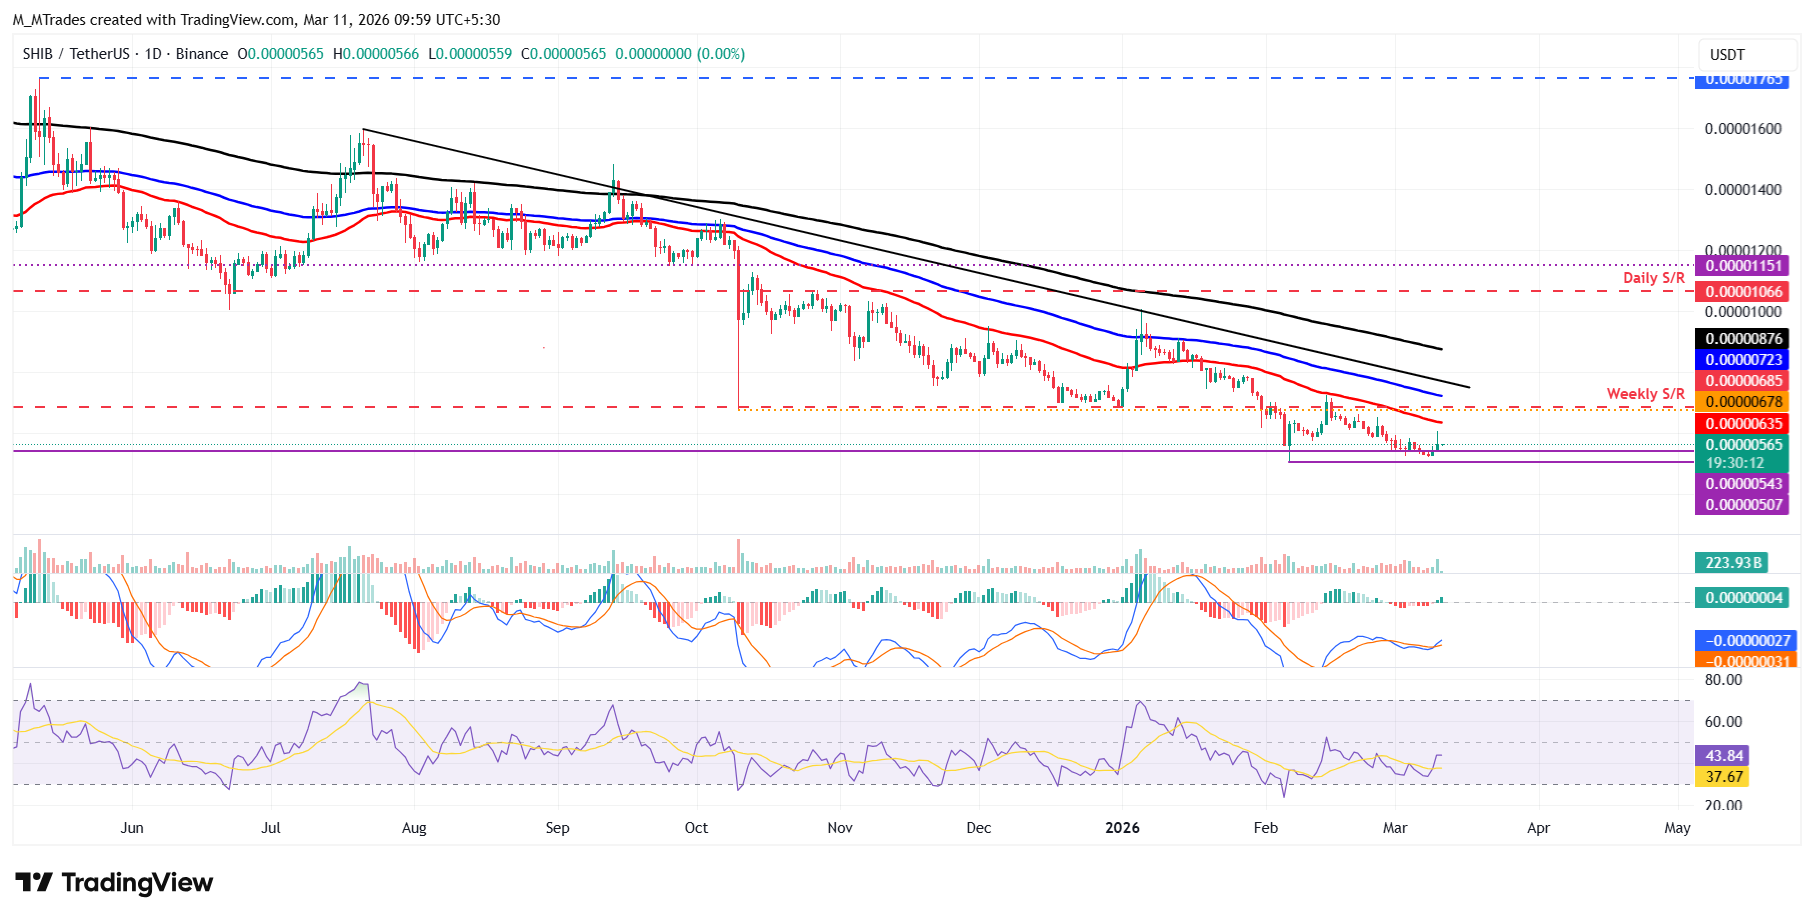
However, if SHIB corrects, it could extend the decline toward the February 6 low of $0.0000050.
Author

Manish Chhetri
FXStreet
Manish Chhetri is a crypto specialist with over four years of experience in the cryptocurrency industry.



